Cruise Narrative
The 2021 A20 cruise is the fourth occupation of the line, nominally 52º 20’ N, formally occupied as part of WOCE in 1997 and reoccupied in 2003 and 2012. A CTD transect of the line was also conducted in 1983. This occupation closely followed the 2012 GO-SHIP occupation except for an eastward shift of ~0.5 – 4 nm of the South American continental shelf stations (75 – 90) due to a slight change in the French Guiana EEZ in 2018. The original WOCE occupation had continental shelf and slope stations in the Suriname rather than French Guiana EEZ. A total of 98 stations were planned and a total of 90 were actually occupied. Unlike in 2012, the transect was conducted from north to south, as was done in 1997 and 2003. The March – April timing was slightly different than the April – May timing of the 2012 occupation, compared to July – August in 1997 and October – September in 2003. The full suite of core GO-SHIP chemical and physical parameters were measured (as described in the following sections) and will be compared to prior occupations for analysis of decadal scale changes covering 24 years.
The cruise departed Woods Hole, Massachusetts at 13:00 on March 16, 2021, after a four-day mobilization beginning on March 12. Due to the ongoing COVID-19 pandemic all participants were required to self-isolate for 14 days before boarding and receive two negative COVID tests prior to boarding. Those based in Florida were able to do their self-isolation there and board in Port Everglades, FL to avoid the risks of air travel. Once on-board, participants were not allowed to leave until arrival in St. Thomas, or back in Woods Hole for those also participating in A22. Mask wearing and social distancing was practiced as required by Coast Guard rules. Also, to reduce the risks of ocean research during a pandemic the number of science crew was kept to a minimum. Therefore, ancillary measurements which required an additional berth were not allowed. The smaller than normal science crew did present some challenges, as there were fewer extra helping hands than usual.
The station plan followed the 2012 stations closely, especially near the Grand Banks across the continental slope and shelf, as well as on the South American continental rise where tight station spacing (10 –13 nm) was maintained in water depths of up to 4900 m. Such tight spacing off of South America allowed for resolution of the Deep Western Boundary Current (DWBC) and the Guiana recirculation. Station resolution in the interior, deep, portion of the section was higher than that achieved in 2012. South of the continental shelf and slope of the Grand Banks (southeast of Newfoundland) 30 nm spacing was maintained between ~39 – 41º N (stations 16 – 21) which included crossing of the Gulf Stream, located near 40º N during our occupation. The location of the Gulf Stream was further north than it was in 2012 (between 38 and 39º N). Altimetry and sea surface temperature data indicate that the Gulf Stream had migrated slightly northward in the month proceeding this occupation. A storm awaited us at the first station causing a 24-hour delay to the beginning of science operations. Between 38º 33.36’ N and 35º 13.32’ N (stations 22 – 26) spacing was widened to 40 nm both to allow us to make up some of the time lost to weather, and also to avoid a large storm moving across the North Atlantic. The storm avoidance was successful and station spacing was narrowed to 35 nm from 35º 13.32’ N to 10º 8.34’N (stations 27 – 69), at which point the South American rise was reached and station spacing tightened to follow the same spacing as in 2012. After the storm encountered at the first station, winds calmed down over the first few days of scientific operations and warm calm weather graced the remainder of the cruise.
Physical Oceanography
After a 1500-m-deep shakedown profile (station number 900) was collected at 41º 00.4’ N 66º 14.4’ W, the vessel proceeded to the first station of the section at 43º 06.3’ N 50º 43.9’ W. Sampling commenced on March 21, proceeding SSW-ward down the continental slope before turning southward at station 16. On stations 1-7 the upper 200m of the water column was comprised of cold Labrador Sea coastal water with temperatures below 3 degrees flowing predominantly eastward over the shelf break (stations 2-6) and northward on station 7 (Figures 1 and 2). The velocity field over the slope was complex and both horizontally and vertically sheared with evidence for eddy motion over the upper slope. Between 2000 m and 4500 m the density measurements show an approximately 200-m-thick boundary current carrying North Atlantic Deep Water (NADW) westward along the slope beneath a spatially variable current field. Between stations 9 and 19, the velocities above 3000 m are consistent with the “strong Northern Recirculation Gyre (NRG)” described in the cruise report of the previous occupation of this section [McCartney2012]. Below 3000 m, there were alternating currents with both east and westward flow likely affected by the topography. Westward zonal flow in the southern limb of the NRG (stations 18-19) extended across the full water column, consistent with the inferred forcing by the Gulf Stream, which dominated the currents on stations 20-22.
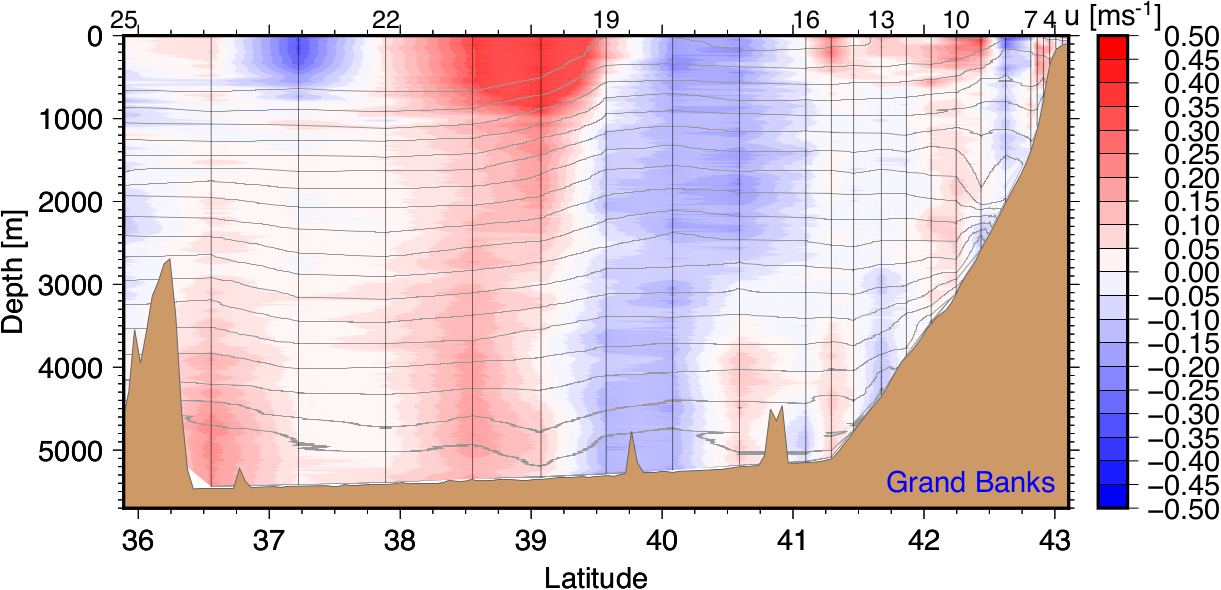
Zonal velocity in the northern part of the section from the LADCP measurements; contours show arbitrarily spaced sigma-2 surfaces from the CTD data.
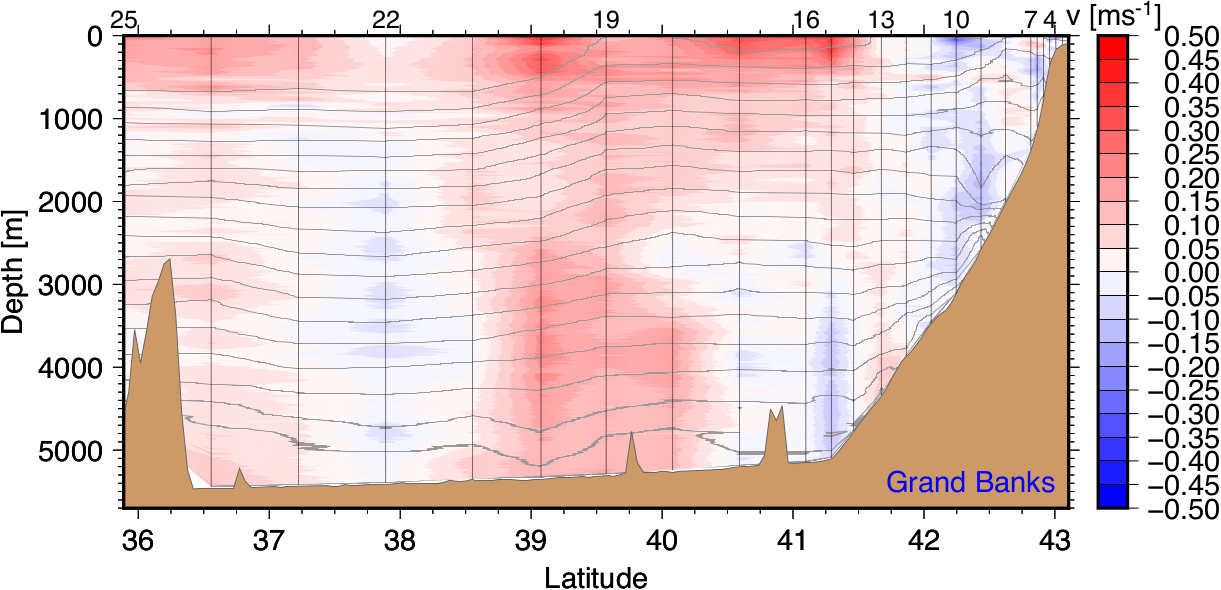
Meridional velocity in the northern part of the section from the LADCP measurements; contours show arbitrarily spaced sigma-2 surfaces from the CTD data.
South of the Gulf Stream the cross-sectional (i.e. zonal) currents in the upper 1000 m show alternating bands with west- and eastward flow components extending all across the basin interior well into the tropics (figure 3). At greater depths the currents along the base of the flank of the Mid-Atlantic Ridge (MAR) that is corrugated by Fracture Zone valleys are both weaker and without clear spatial patterns, except for an apparent anticyclonic circulation around and above the Corner Seamounts near 36º N. South of about 32º N there is evidence (figure 4) for the topographic roughness of the MAR to elevate the energy in the high-frequency internal-wave field, which is closely related to turbulence and mixing.
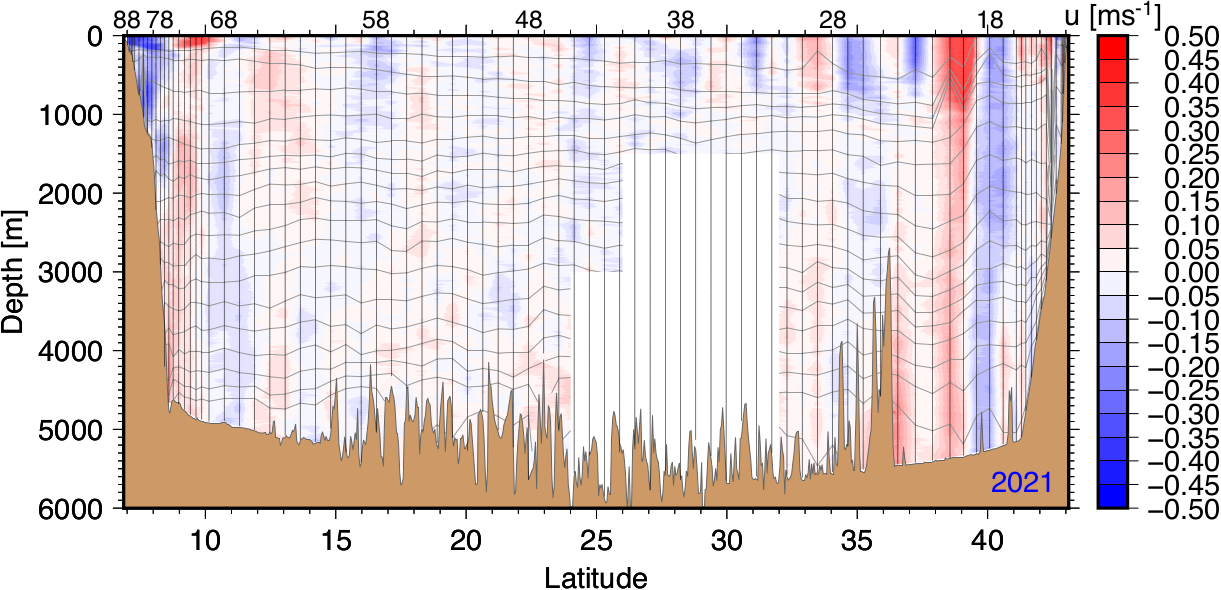
Zonal velocity along the entire section from the LADCP measurements; contours show arbitrarily spaced sigma-2 surfaces from the CTD data. The data gap at depth between 24 and 32N is caused by insufficient acoustic backscatter contaminating the LADCP velocities.
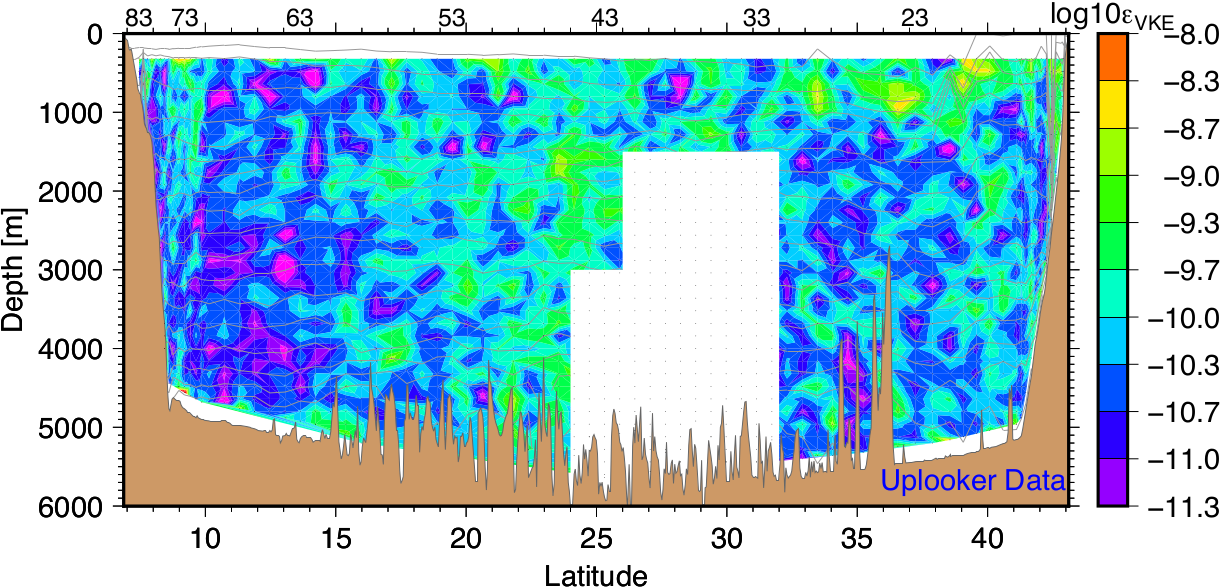
Vertical kinetic energy from the LADCP-derived vertical velocity measurements scaled into units of dissipation of turbulent kinetic energy [Thurnherr2015]; contours and data gap as in Figure 3.
South of ~15º N the Mid-Atlantic Ridge trends southeastward and the remainder of the section crosses a smooth abyssal plain before encountering the base of the South American continental slope of the Demerara Plateau on station 76 (figure 5). The zonal currents over the abyssal plain were meridionally banded and mostly spanned the full ocean depth. Over the continental slope the currents were complex and vertically sheared. The strong eastward flow below 2000 m over the lower slope (stations 76-79) is part of the DWBC carrying NADW along the American continent into the South Atlantic [Johns1993]. In the 2012 occupation of A20, eastward flow along this slope extended all the way up to about 1000m [McCartney2012] but during our occupation an anticyclonic eddy occupied the water column between 1000 and 2000 m extending out to about 10º N. Between 200 and 1000 m all LADCP data collected in 2003, 2012 as well as in our occupation show a meridional dipole structure with westward flow banked against the slope and eastward flow further offshore, also extending to 10º N. In the upper 200 m of the water column, the North Brazil Current is flowing westward along the shelf break. In our data as well as in the 2003 occupation the North Brazil Current is bounded offshore by a strong eastward current, which could be its retroflection or, alternatively, a Brazil Current Ring. (In 2012 the North Brazil Current was similar to our observations but there was no eastward flow further offshore.)
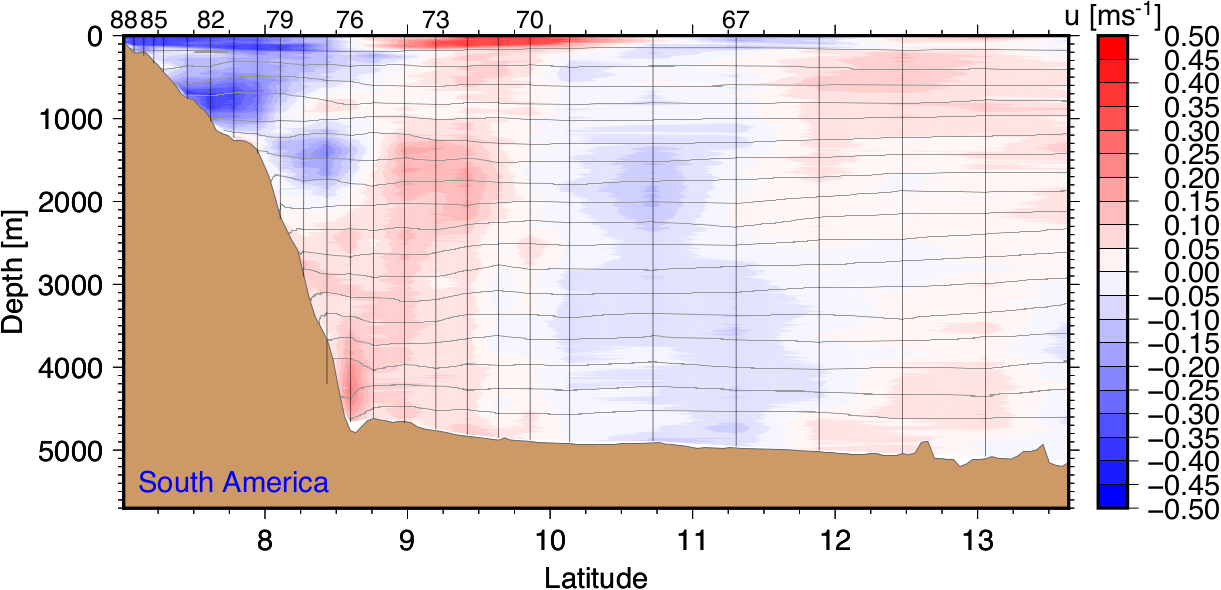
Zonal velocity in the southern part of the section from the LADCP measurements; contours show arbitrarily spaced sigma-2 surfaces from the CTD data.
Similar to the observations in 2012 (McCartney et al., 2012) we encountered the Amazon River Plume extending a considerable distance off the shelf break. In our observations (figure 6) this freshwater plume is limited to depths shallower than 10m, with the fresh water at the offshore edge of the plume (~100 km from the shelf break; station 80) extending no further than 80 cm below the sea surface. (The 10-30 cm thick almost completely fresh layers very close to the surface in profiles 82, 88 and 89 are likely caused by rainfall.)
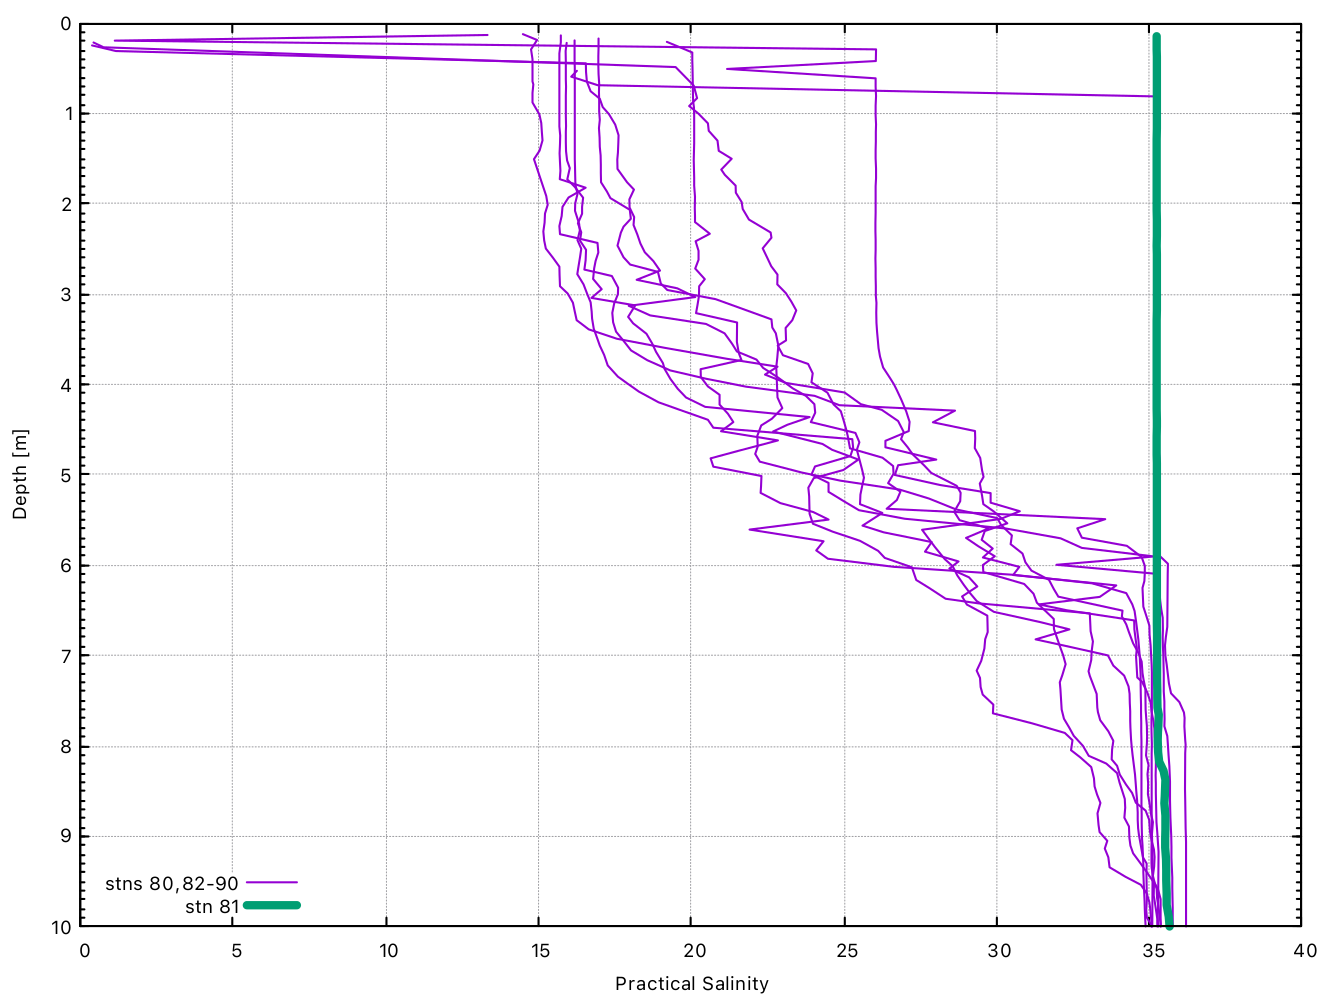
CTD-derived salinity profiles close to the sea surface at the end of the upcasts, derived from specially processed 24-Hz data.
Chemical Oceanography
The distribution of basic chemical and physical parameters were very similar to those of prior occupations in the deep water. The early March timing of this occupation explains the generally colder surface waters compared to 2012. The difference was most noticeable in the northern portion of the section over the Grand Banks, which were generally ~5ºC colder in 2021 compared to 2012. The deeper winter mixing was also obvious by the deeper penetration of high oxygen, and fresher, lower total alkalinity waters over the continental shelf and rise.
The slightly more northern location of the Gulf Steam in 2021 leads to significantly different structure to the chemical and physical properties between ~38 – 40ºN and must be accounted for when comparing the different occupations. The oxygen minimum between ~30 – 40ºN appears to be slightly deeper in 2021 as evidenced by a slight shift in the density structure in the upper water column. The shift is also clearly visible in the inorganic carbon parameters.
The upper 1000 m shows a general increase in dissolved inorganic carbon (DIC) of ~20 µmol/kg since 2012 with a corresponding decrease in pH. The increase in DIC is consistent with the increasing CO2 content of the atmosphere due to anthropogenic activities. The near constant salinity normalized total alkalinity (TA) further supports the anthropogenic cause of increased DIC and decreased pH. There is also an area of increased DIC (~10 µmol/kg) compared to 2003 at around 1500 m consistent with Labrador Sea Water as identified in the 2012 occupation [Woosley2016].
The outflow from the Amazon River can clearly be seen as a thin plume of freshwater in the upper ~10 m at the southernmost portion of the section. In 2012 the plume extended unusually far north (to about 11º N). In this occupation the plume was clearly marked by a drop in surface salinity to < 30 at ~ 7.8º N. Although the plume did not extend as far north, it was slightly fresher this occupation compared to 2012.
- Johns1993
Johns, W. E., D. M. Fratantoni, and R. J. Zantopp (1993), Deep western boundary current variability off northeastern Brazil, Deep-Sea Research, 40(2), doi: 10.1016/0967-0637(93)90005-N.
- McCartney2012(1,2)
McCartney, M. (2012) US Global Ocean Carbon and Repeat Hydrography Program Section CLIVAR A20 RV Atlantis AT20
- Thurnherr2015
Thurnherr, A. M., E. Kunze, J. M. Toole, L. St. Laurent, K. J. Richards, and A. Ruiz-Angulo (2015). Vertical kinetic energy and turbulent dissipation in the ocean. Geophys. Res. Lett. 42, 7639–7647.
- Woosley2016
Woosley, R. J., F. J. Millero, and R. Wanninkhof (2016), Rapid anthropogenic changes in CO2 and pH in the Atlantic Ocean: 2003–2014, Global Biogeochem. Cycles, 30, doi:10.1002/2015GB005248.