CTDO and Hydrographic Analysis
- PIs
Susan Becker
James Swift
- Technicians
Michael Kovatch
CTDO and Bottle Data Acquisition
The CTD data acquisition system consisted of an SBE-11+ (V2) deck unit and a networked generic PC workstation running Windows 10. SBE SeaSave7 v.7.26.7.107 software was used for data acquisition and to close bottles on the rosette.
CTD deployments were initiated by the console watch operators (CWO) after the ship had stopped on station. The watch maintained a CTD cast log for each attempted cast containing a description of each deployment event and any problems encountered.
Once the deck watch had deployed the rosette, the winch operator would lower it to 10 meters. The CTD sensor pumps were configured to start 10 seconds after the primary conductivity cell reports salt water in the cell. The CWO checked the CTD data for proper sensor operation, waited for sensors to stabilize, and instructed the winch operator to bring the package to the surface in good weather or no more than 5 meters in high seas. The winch was then instructed to lower the package to the initial target wire-out at no more than 30 m/min for the first 100 m and no more than 6 0m/min after 100 m depending on sea-cable tension and the sea state.
The CWO monitored the progress of the deployment and quality of the CTD data through interactive graphics and operational displays. The altimeter channel, CTD pressure, wire-out and center multi-beam depth were all monitored to determine the distance of the package from the bottom. The winch was directed to slow decent rate to 30 m/min 100 m from the bottom. The bottom of the CTD cast was usually to within 10-20 meters of the bottom determined by altimeter data. For each upcast, the winch operator was directed to stop the winch at up to 36 predetermined sampling pressures. These standard depths were staggered every station using 3 sampling schemes. The CTD CWO waited 30 seconds prior to tripping sample bottles, to ensure package had shed its wake. An additional 15 seconds elapsed before moving to the next consecutive trip depth, which allowed for the SBE35RT to record bottle trip temperature averaged from 13 samples.
After the last bottle was closed, the CWO directed winch to recover the rosette. Once the rosette was out of the water and on deck, the CWO terminated the data acquisition, turned off the deck unit and assisted with rosette sampling.
Additionally, the watch created a sample log for the deployment which recorded the depths bottles were tripped and correspondence between rosette bottles and analytical samples drawn.
Normally the CTD sensors were rinsed after each station using syringes of fresh water connected to Tygon tubing. The tubing was left on the CTD between casts, with the temperature and conductivity sensors immersed in fresh.
Each bottle on the rosette had a unique serial number, independent of the bottle position on the rosette. Sampling for specific programs were outlined on sample log sheets prior to cast recovery or at the time of collection. The bottles and rosette were examined before samples were drawn. Any abnormalities were noted on the sample log, stored in the cruise database and reported in the APPENDIX.
CTDO Data Processing
Shipboard CTD data processing was performed after deployment using SIO/ODF CTD processing software “ctdcal” v. 0.1. CTD acquisition data were copied onto a OS X system, and then processed. CTD data at bottle trips were extracted, and a 2-decibar downcast pressure series created. The pressure series data set was submitted for CTD data distribution after corrections outlined in the following sections were applied.
A total of 90 CTD stations were occupied including one test station. A total of 91 CTDO/rosette/LADCP/chipod casts were completed.
CTD data were examined at the completion of each deployment for clean corrected sensor response and any calibration shifts. As bottle salinity and oxygen results became available, they were used to refine conductivity and oxygen sensor calibrations.
Temperature, salinity and, dissolved O2 comparisons were made between down and upcasts as well as between groups of adjacent deployments. Vertical sections of measured and derived properties from sensor data were checked for consistency.
A number of issues were encountered during A20-2021 that directly impacted CTD analysis. Issues that directly impacted bottle closures, such as slipping guide rings, were detailed in the Underwater Sampling Package section of this report. Temperature, conductivity, and oxygen analytical sensor issues are detailed in the following respective sections.
Sensor Problems
Throughout the cruise, there were problems with multiple SBE43 oxygen sensors. The suspicion is that the sensor membranes were frozen either during transit or while in port. Erratic readings were observed in the upper ~100 m which then disappeared as the cast went deeper. Station 14 is shown as an example.
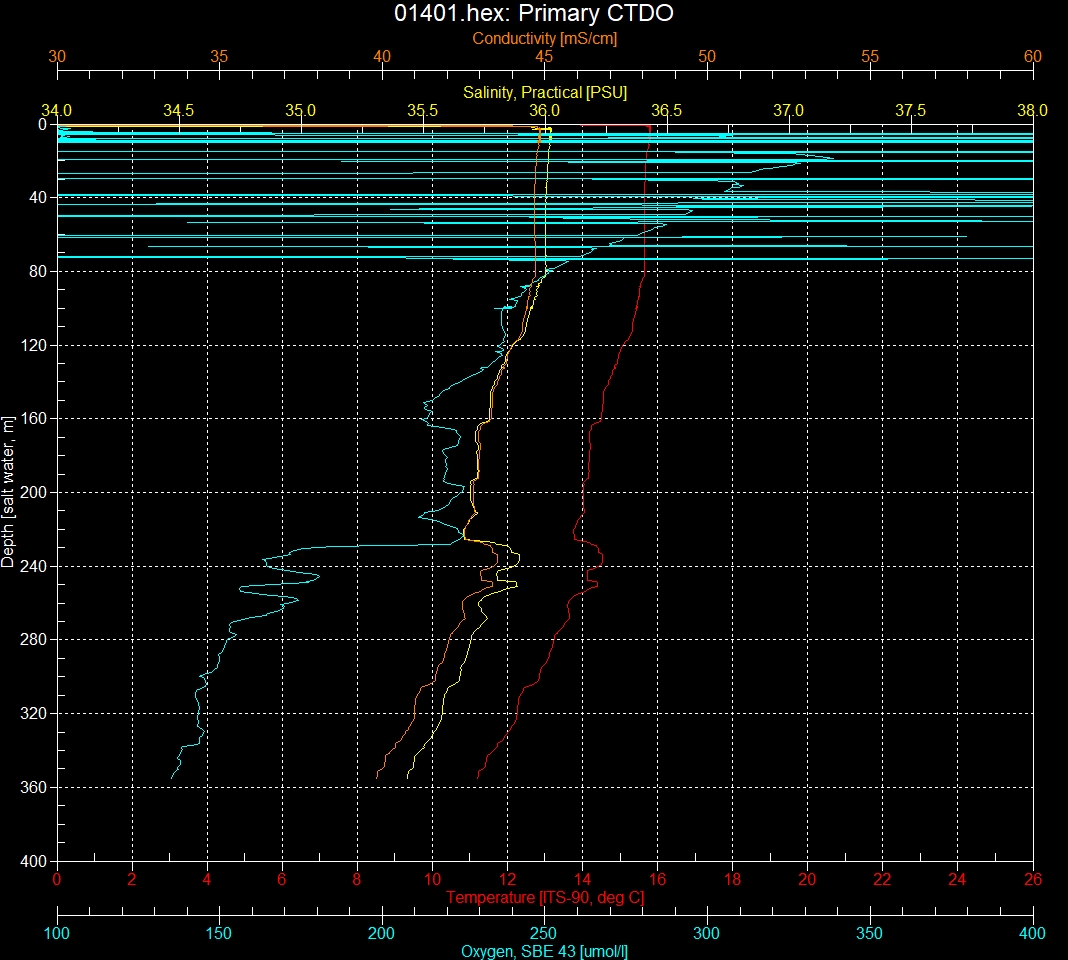
Spiky oxygen in upper 80 m during downcast of station 14.
Pressure Analysis
Laboratory calibrations of CTD pressure sensors were performed prior to the cruise. Dates of laboratory calibration are recorded on the underway sampling package table and calibration documents are provided in the APPENDIX.
The lab calibration coefficients provided on the calibration report were used to convert frequencies to pressure. Initial SIO pressure lab calibration slope and offsets coefficients were applied to cast data. A shipboard calibration offset was applied to the converted pressures during each cast. These offsets were determined by the pre and post-cast on-deck pressure offsets. The pressure offsets were applied per cast.
CTD #0914:
Start P (dbar) |
End P (dbar) |
|
|---|---|---|
Min |
-0.09 |
-0.24 |
Max |
0.53 |
0.35 |
Average |
0.15 |
0.02 |
On-deck pressure reading varied from -0.09 to 0.53 dbar before the casts, and -0.24 to 0.35 dbar after the casts. The pressure offset varied from -0.25 to 0.02, with a mean value of -0.13 dbar.
Temperature Analysis
Laboratory calibrations of temperature sensors were performed prior to the cruise at the SIO Calibration Facility. Dates of laboratory calibration are recorded on the underway sampling package table and calibration documents are provided in the APPENDIX.
The pre-cruise laboratory calibration coefficients were used to convert SBE3plus frequencies to ITS-90 temperature. Additional shipboard calibrations were performed to correct systematic sensor bias. Two independent metrics of calibration accuracy were used to determine sensor bias. At each bottle closure, the primary and secondary temperature were compared with each other and with a SBE35RT reference temperature sensor.
The SBE35RT Digital Reversing Thermometer is an internally-recording temperature sensor that operates independently of the CTD. The SBE35RT was located equidistant between the two SBE3plus temperature sensors. The SBE35RT is triggered by the SBE32 carousel in response to a bottle closure. According to the manufacturer’s specifications, the typical stability is 0.001°C/year. The SBE35RT was set to internally average over 13 samples, approximately a 15 second period.
A functioning SBE3plus sensor typically exhibit a consistent predictable well-modeled response. The response model is second-order with respect to pressure and second-order with respect to temperature:

Fit coefficients are shown in the following tables.
Station |
|
|
|
|
|
|---|---|---|---|---|---|
901-8 |
0.0 |
-1.5802e-7 |
0.0 |
0.0 |
-1.4125e-3 |
9-19 |
0.0 |
-2.0278e-7 |
0.0 |
0.0 |
-1.0778e-3 |
20-90 |
0.0 |
-3.5676e-7 |
0.0 |
0.0 |
8.3290e-5 |


Station |
|
|
|
|
|
|---|---|---|---|---|---|
901-8 |
0.0 |
-3.4637e-7 |
0.0 |
0.0 |
-7.6459e-4 |
9-19 |
0.0 |
-1.4643e-7 |
0.0 |
0.0 |
-7.5597e-4 |
20-90 |
-5.0915e-11 |
1.4995e-7 |
0.0 |
0.0 |
-8.5699e-4 |
Corrected temperature differences are shown in the following figures.
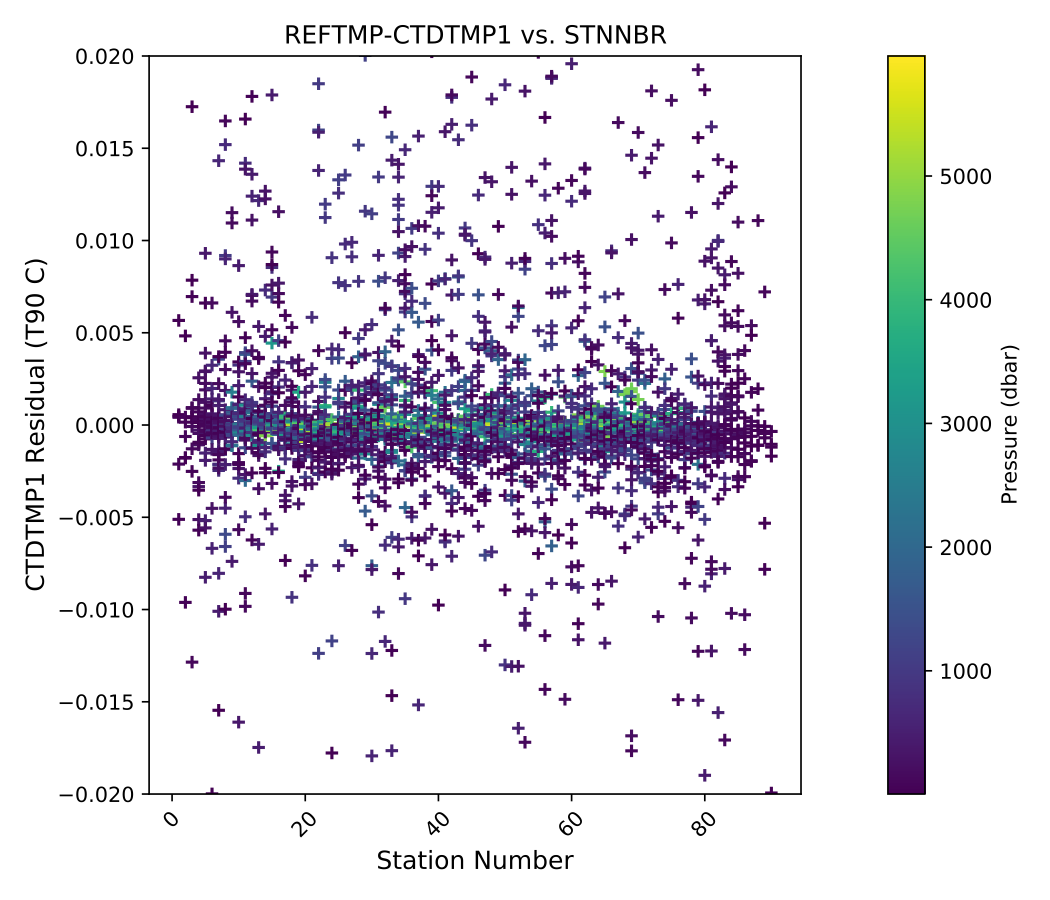
SBE35RT-T1 versus station.

Deep SBE35RT-T1 by station (Pressure  2000dbar).
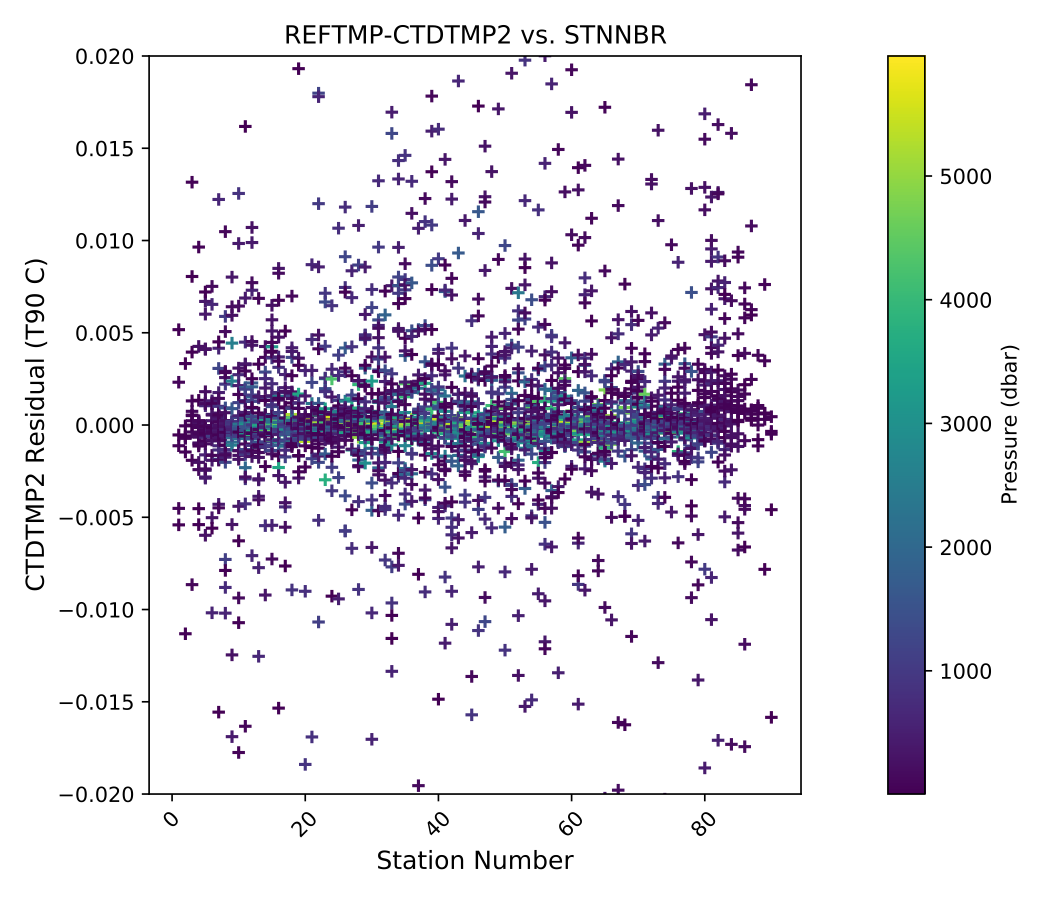
SBE35RT-T2 versus station.
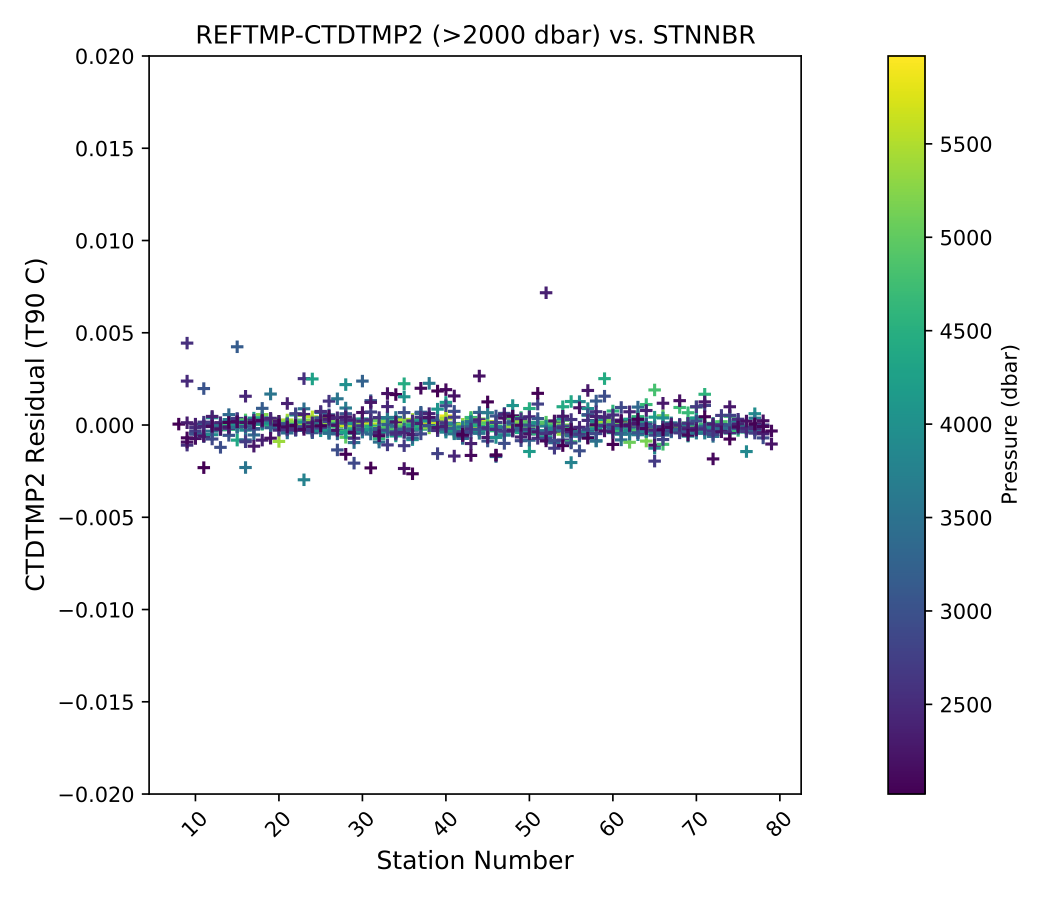
Deep SBE35RT-T2 by station (Pressure 2000dbar).
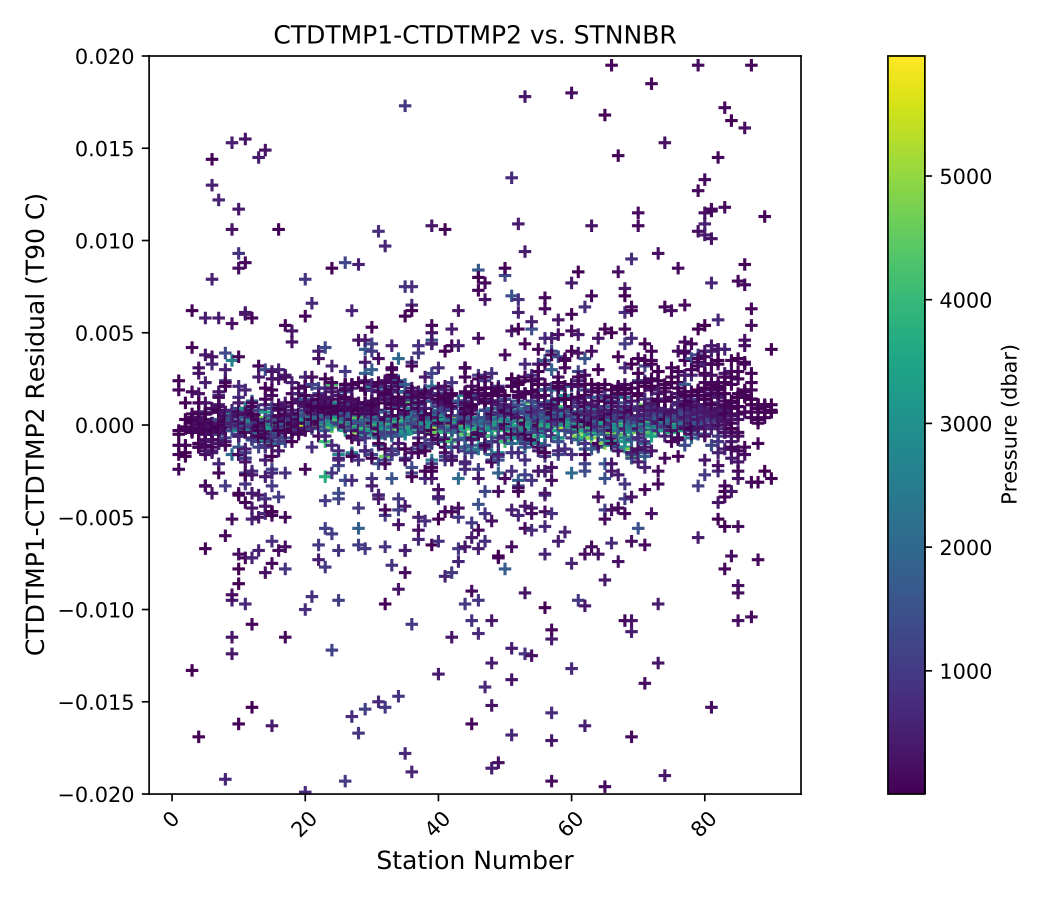
T1-T2 versus station.
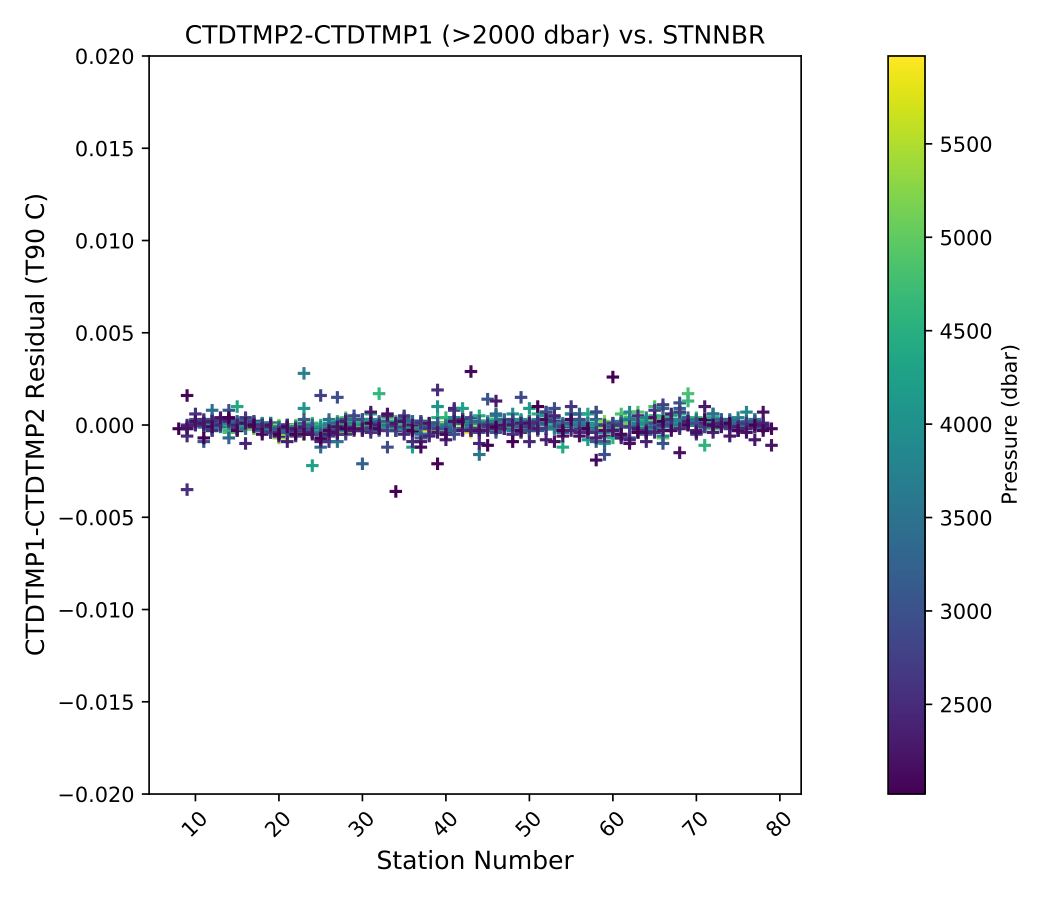
Deep T1-T2 versus station (Pressure 2000dbar).
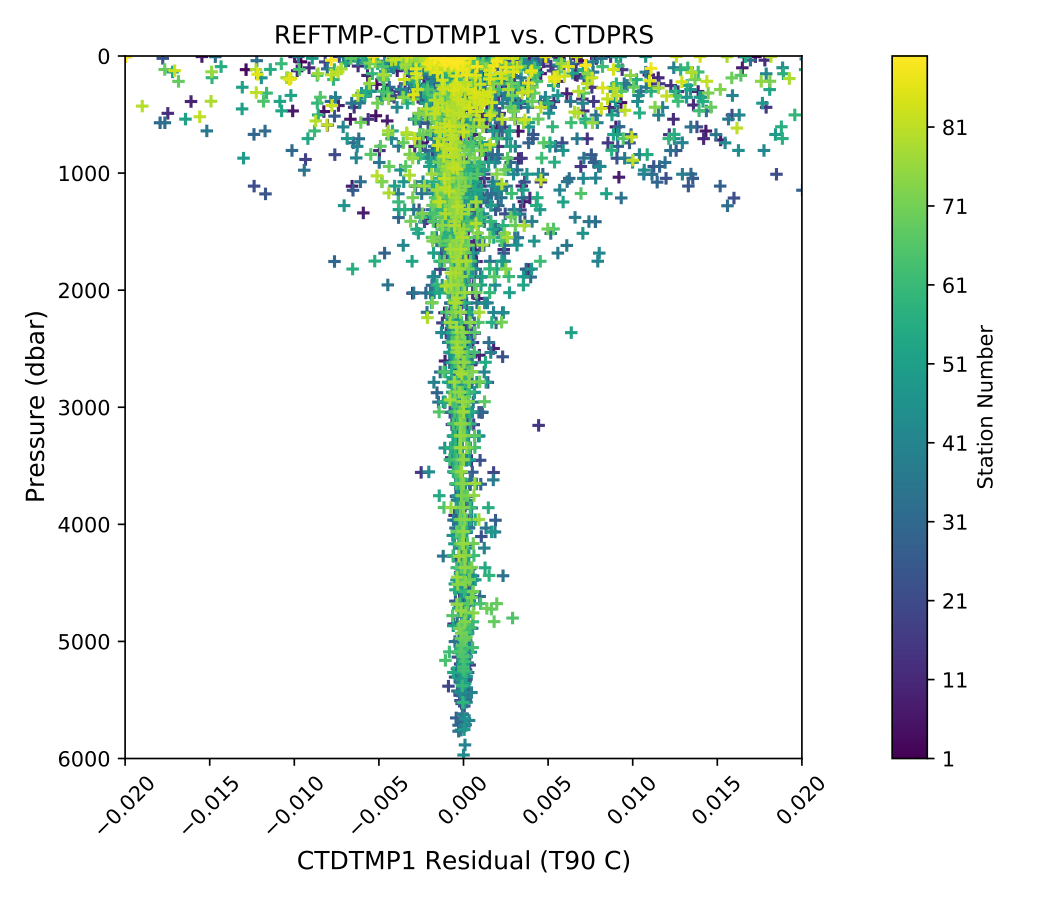
SBE35RT-T1 versus pressure.
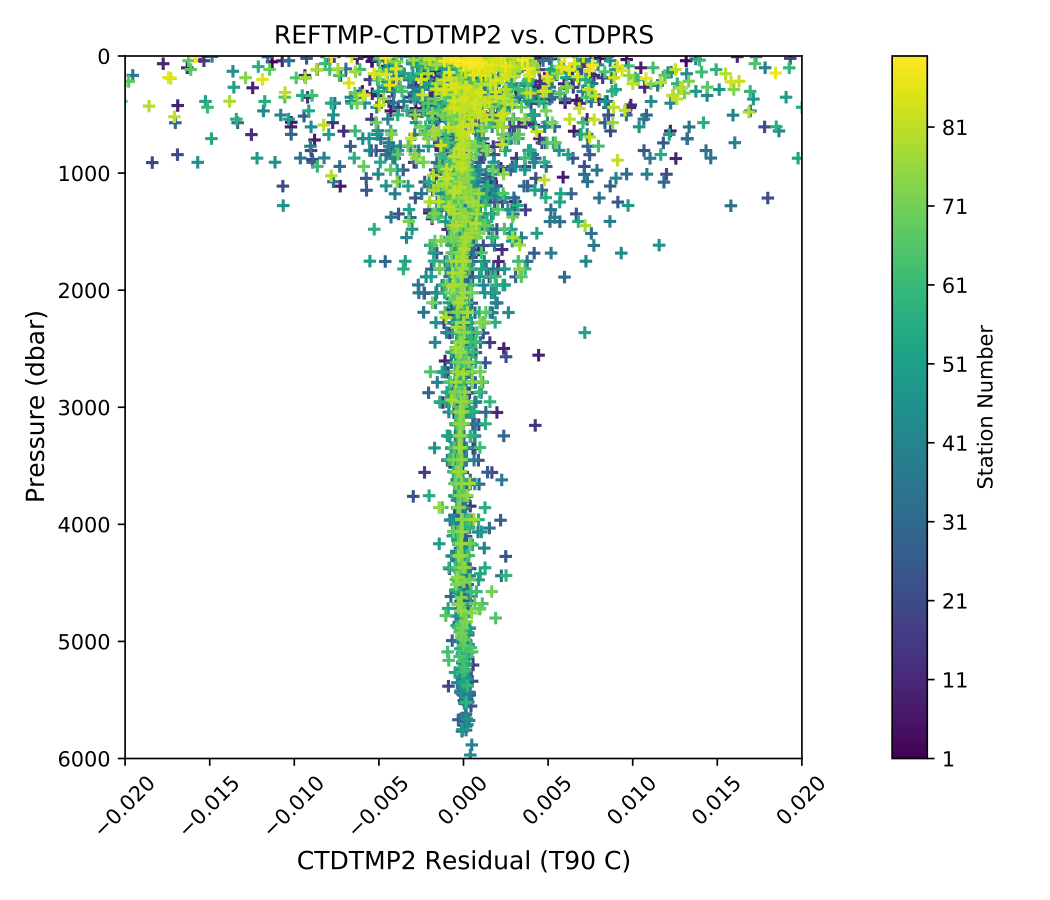
SBE35RT-T2 versus pressure.
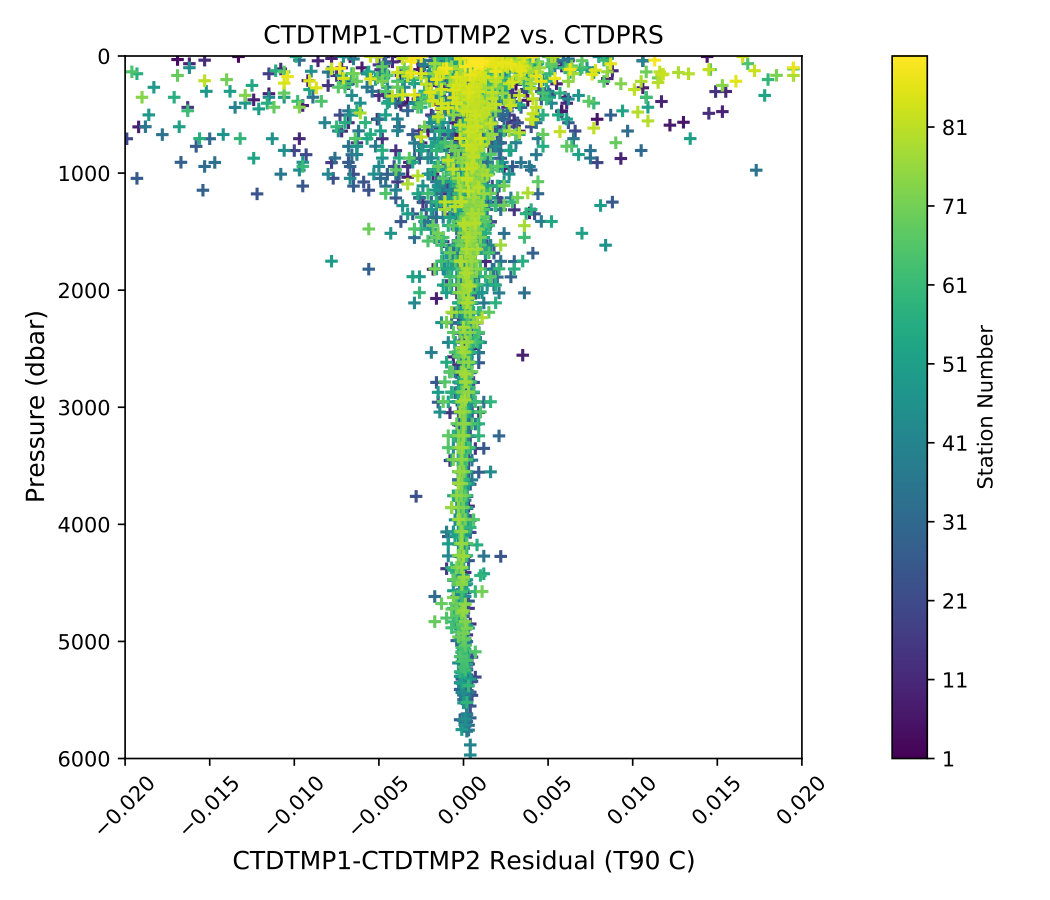
T1-T2 versus pressure.
The 95% confidence limits for the mean low-gradient (values -0.002°C  T1-T2 0.002°C) differences are ±0.00456°C for SBE35RT-T1, ±0.00452°C for SBE35RT-T2 and ±0.00153°C for T1-T2.
The 95% confidence limits for the deep temperature residuals (where pressure 2000dbar) are ±0.00107°C for SBE35RT-T1, ±0.00119°C for SBE35RT-T2 and ±0.00098°C for T1-T2.
T1-T2 0.002°C) differences are ±0.00456°C for SBE35RT-T1, ±0.00452°C for SBE35RT-T2 and ±0.00153°C for T1-T2.
The 95% confidence limits for the deep temperature residuals (where pressure 2000dbar) are ±0.00107°C for SBE35RT-T1, ±0.00119°C for SBE35RT-T2 and ±0.00098°C for T1-T2.
- Minor complications impacted the temperature sensor data used for the A20-2021 cruise.
Early stations had bottles fired on the fly, leading to some SBE35RT averaging periods outside of the intended depth.
Near-surface temperature gradients in the southern end of the survey were extremely sharp, occasionally causing SBE35RT readings to be questionable.
The resulting affected sections of data have been coded and documented in the quality code APPENDIX.
Conductivity Analysis
Laboratory calibrations of conductivity sensors were performed prior to the cruise at the Sea-Bird Calibration Facility. Dates of laboratory calibration are recorded on the underway sampling package table and calibration documents are provided in the APPENDIX.
The pre-cruise laboratory calibration coefficients were used to convert SBE4C frequencies to mS/cm conductivity values. Additional shipboard calibrations were performed to correct sensor bias. Corrections for both pressure and temperature sensors were finalized before analyzing conductivity differences. Two independent metrics of calibration accuracy were examined. At each bottle closure, the primary and secondary conductivity were compared with each other. Each sensor was also compared to conductivity calculated from check sample salinities using CTD pressure and temperature.
The differences between primary and secondary temperature sensors were used as filtering criteria to reduce the contamination of conductivity comparisons by package wake. The coherence of this relationship is shown in the following figure.
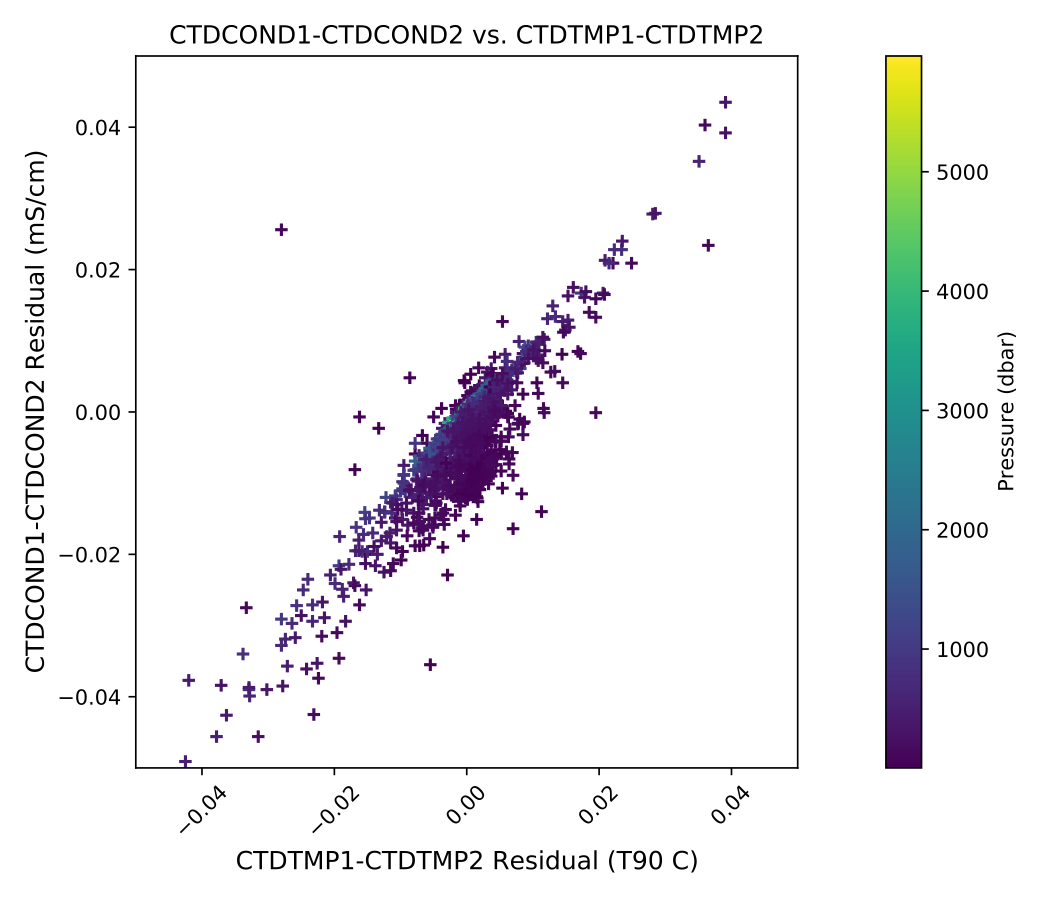
Coherence of conductivity differences as a function of temperature differences.
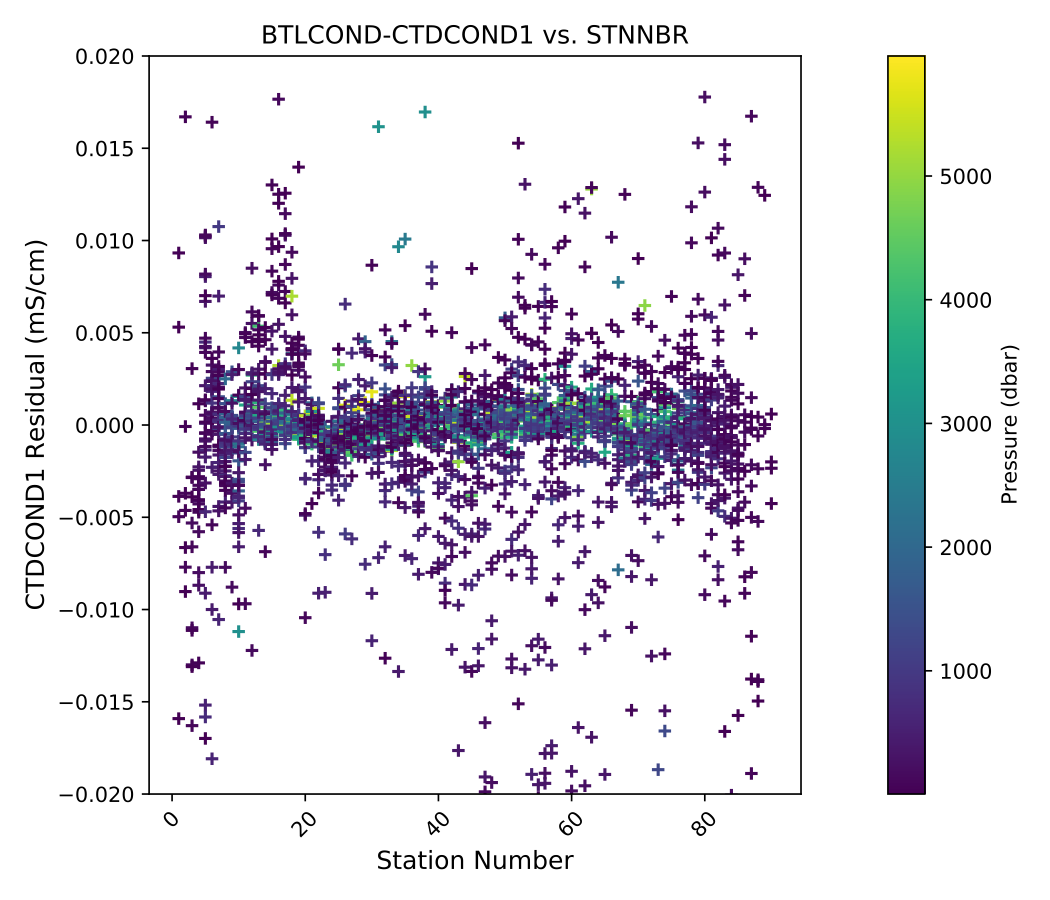
Corrected CBottle - C1 versus station.
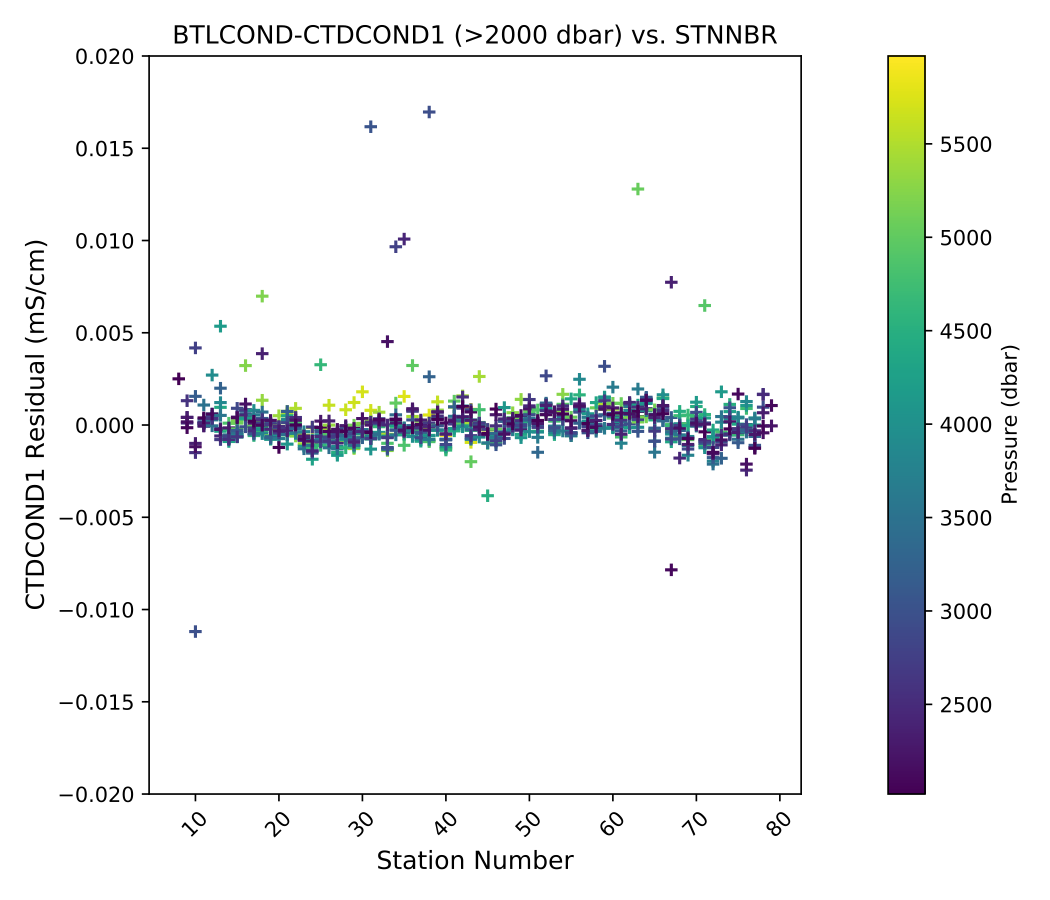
Deep Corrected CBottle - C1 versus station (Pressure >= 2000dbar).
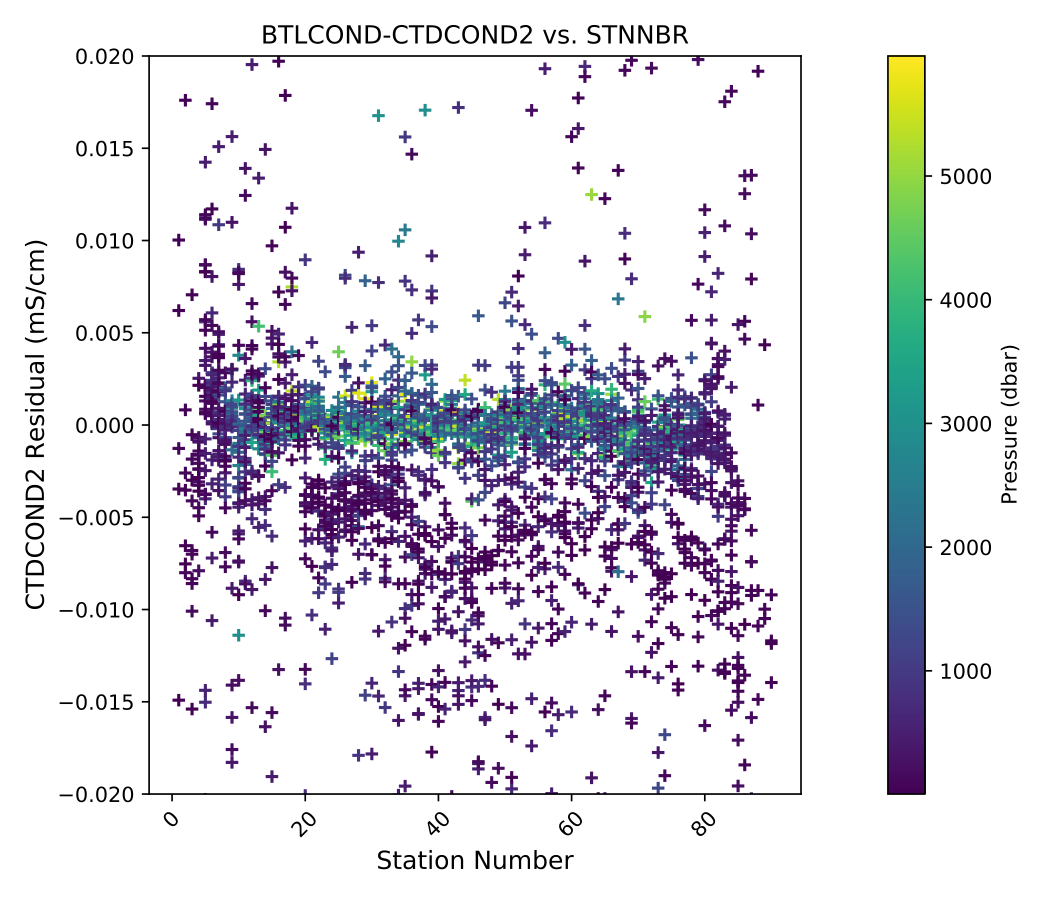
Corrected CBottle - C2 versus station.
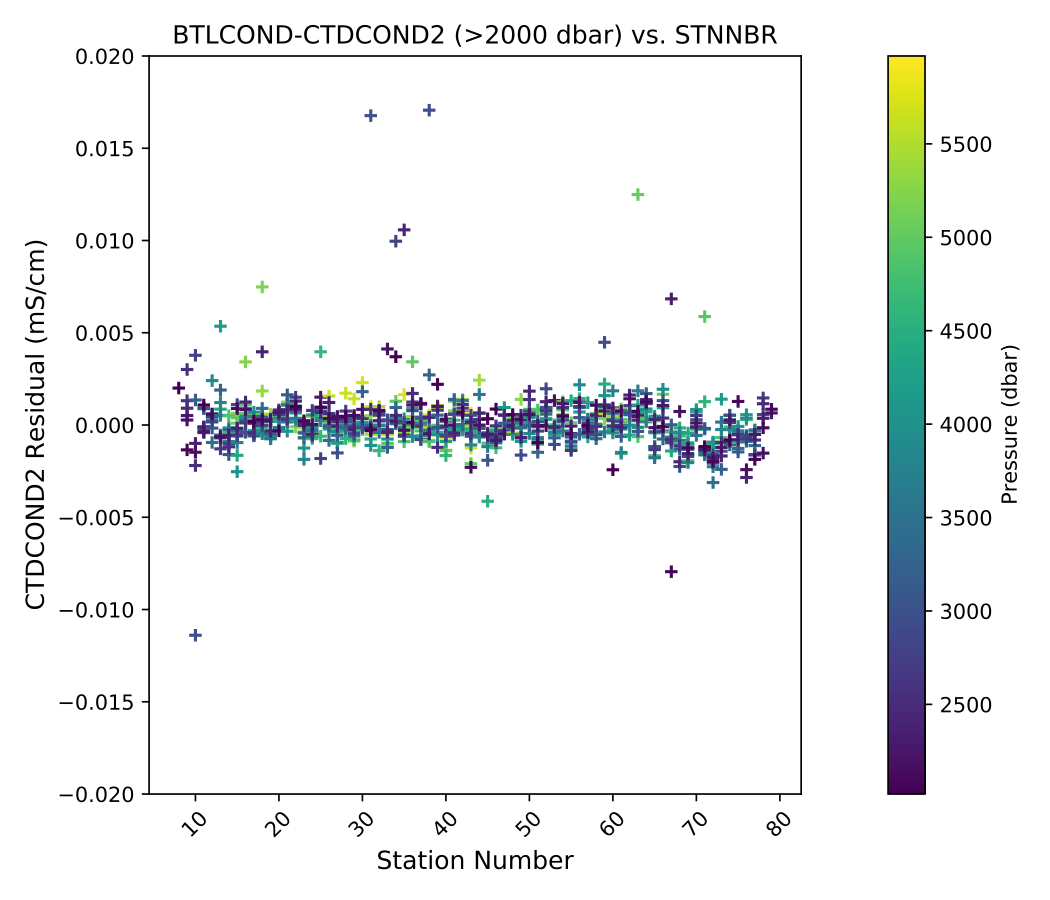
Deep Corrected CBottle - C2 versus station (Pressure >= 2000dbar).
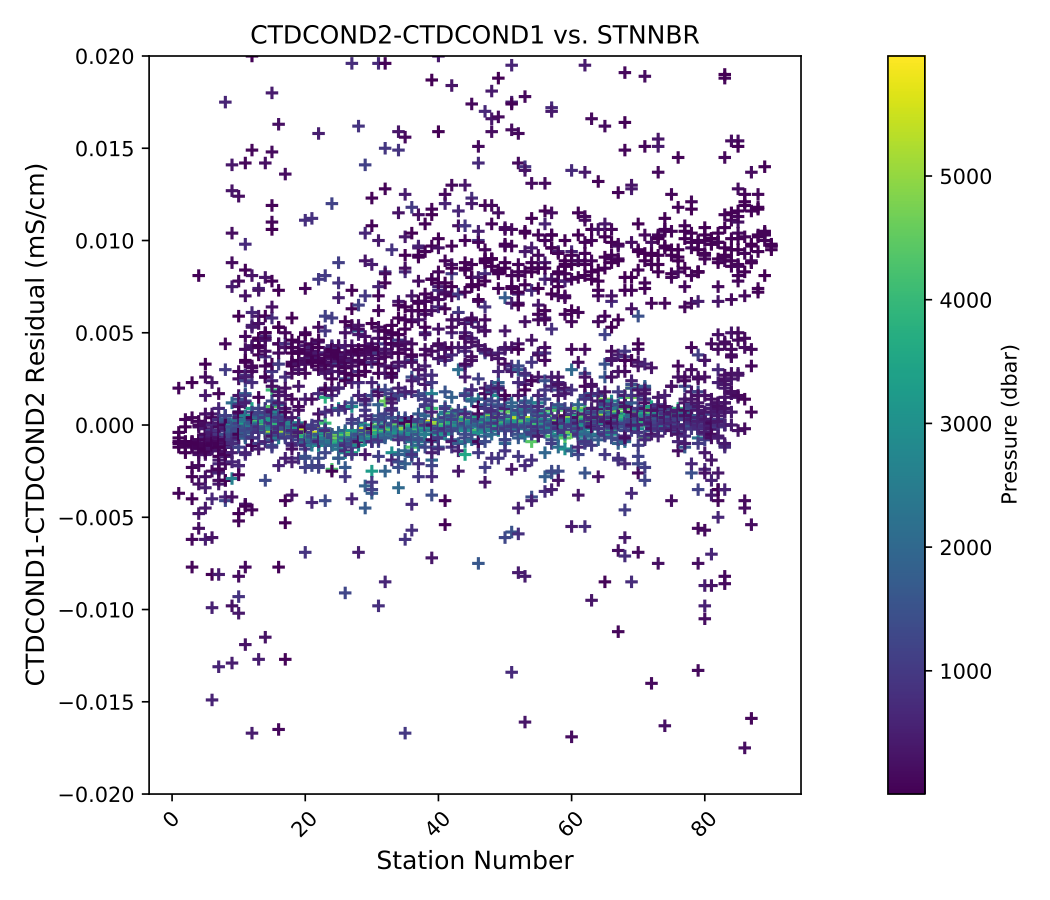
Corrected C1-C2 versus station.
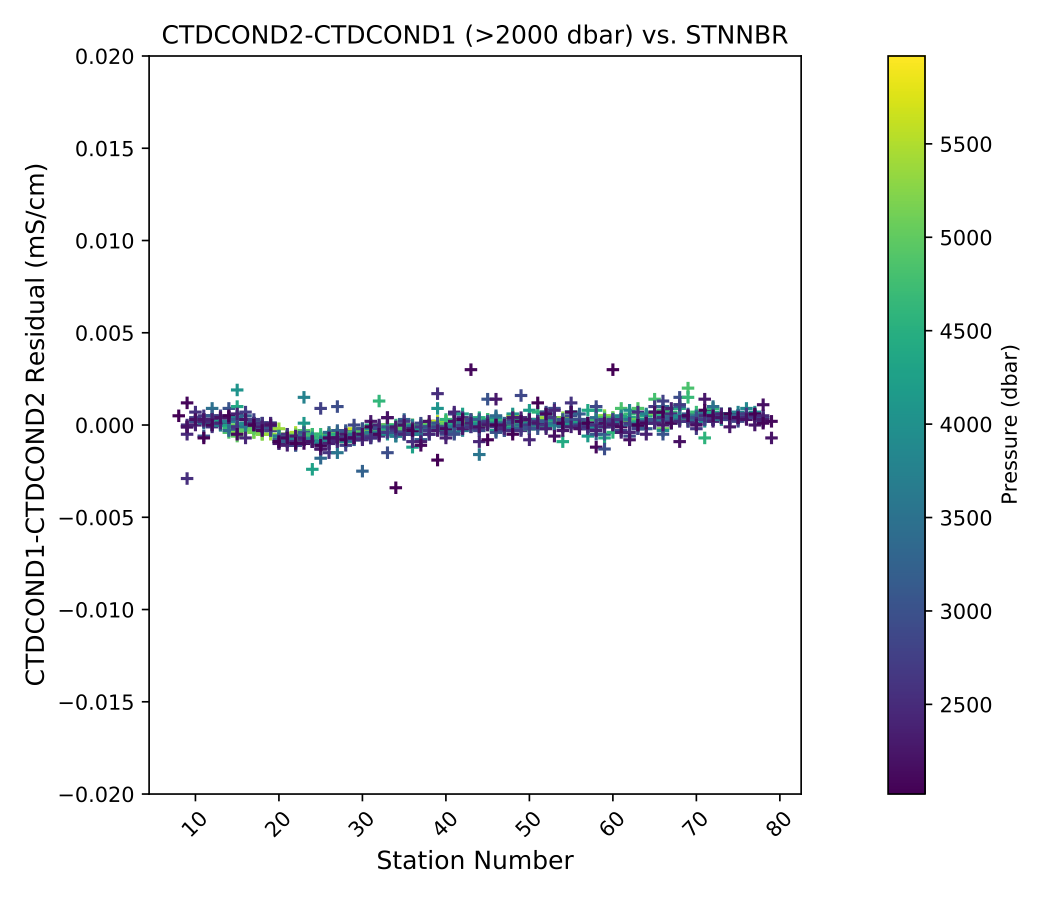
Deep Corrected C1-C2 versus station (Pressure >= 2000dbar).
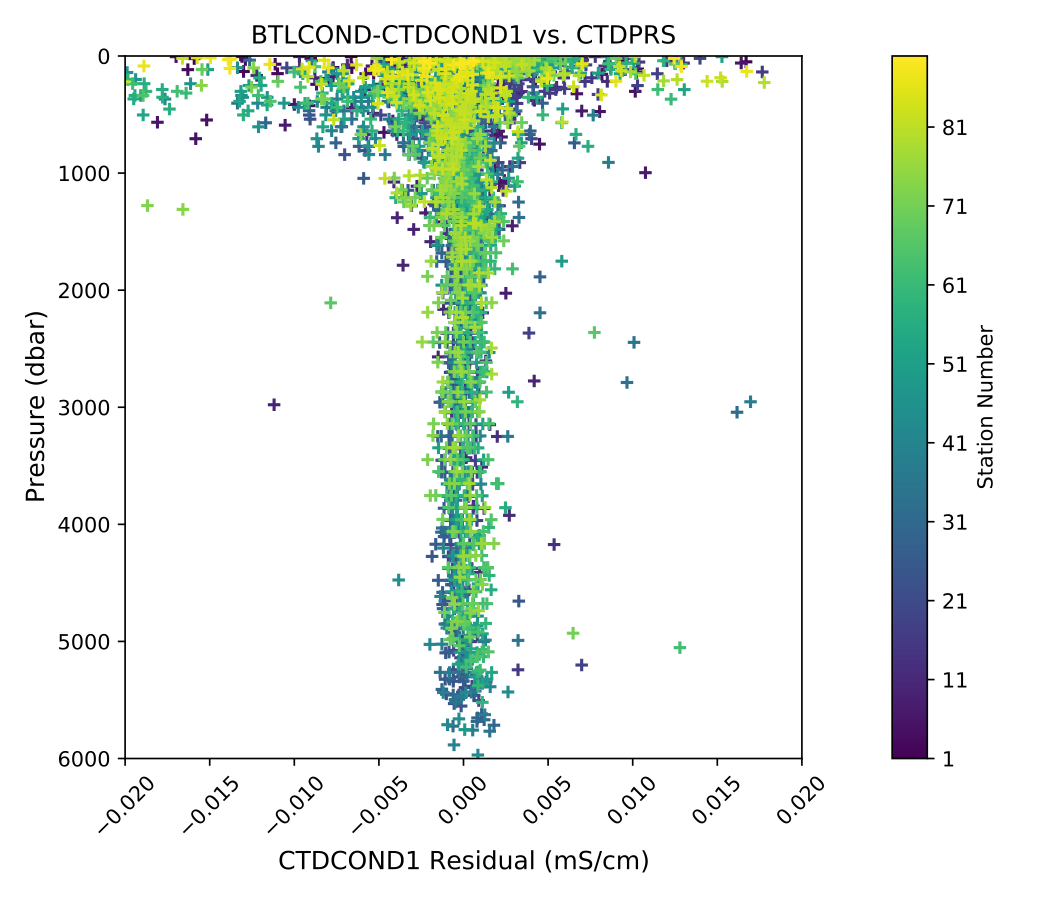
Corrected CBottle - C1 versus pressure.
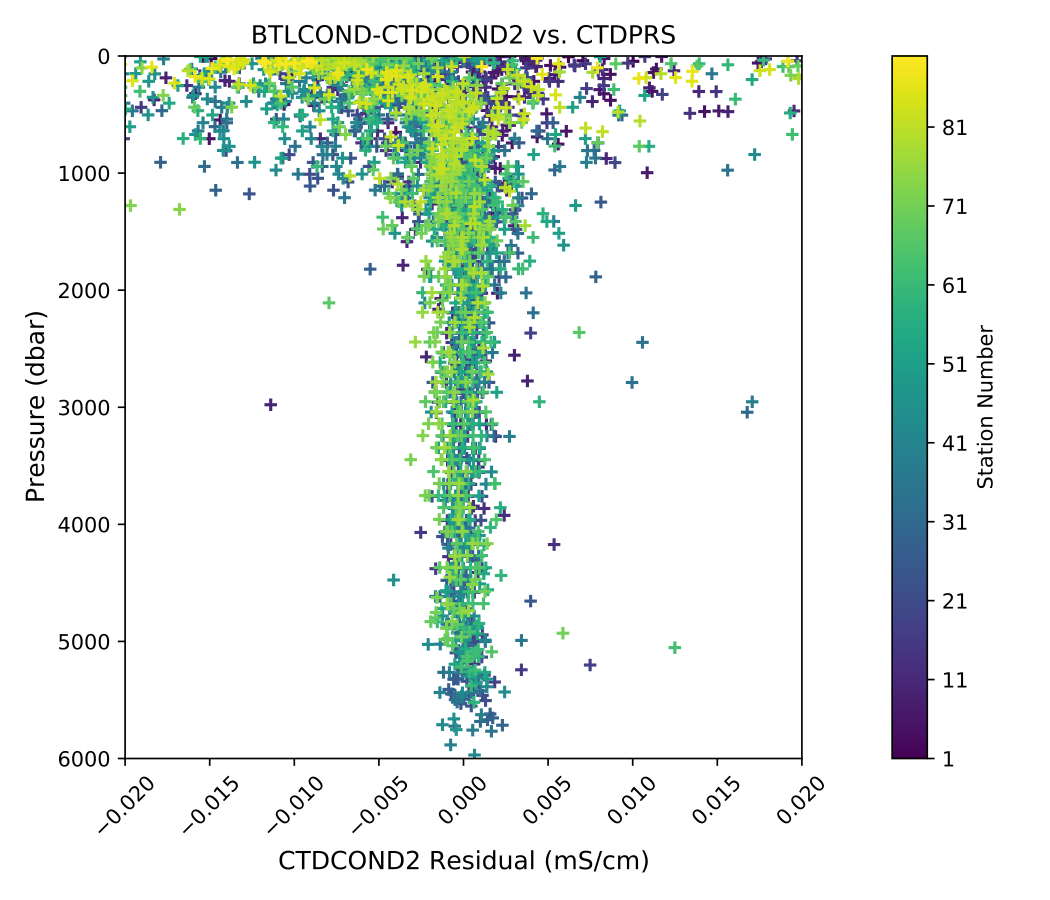
Corrected CBottle - C2 versus pressure.
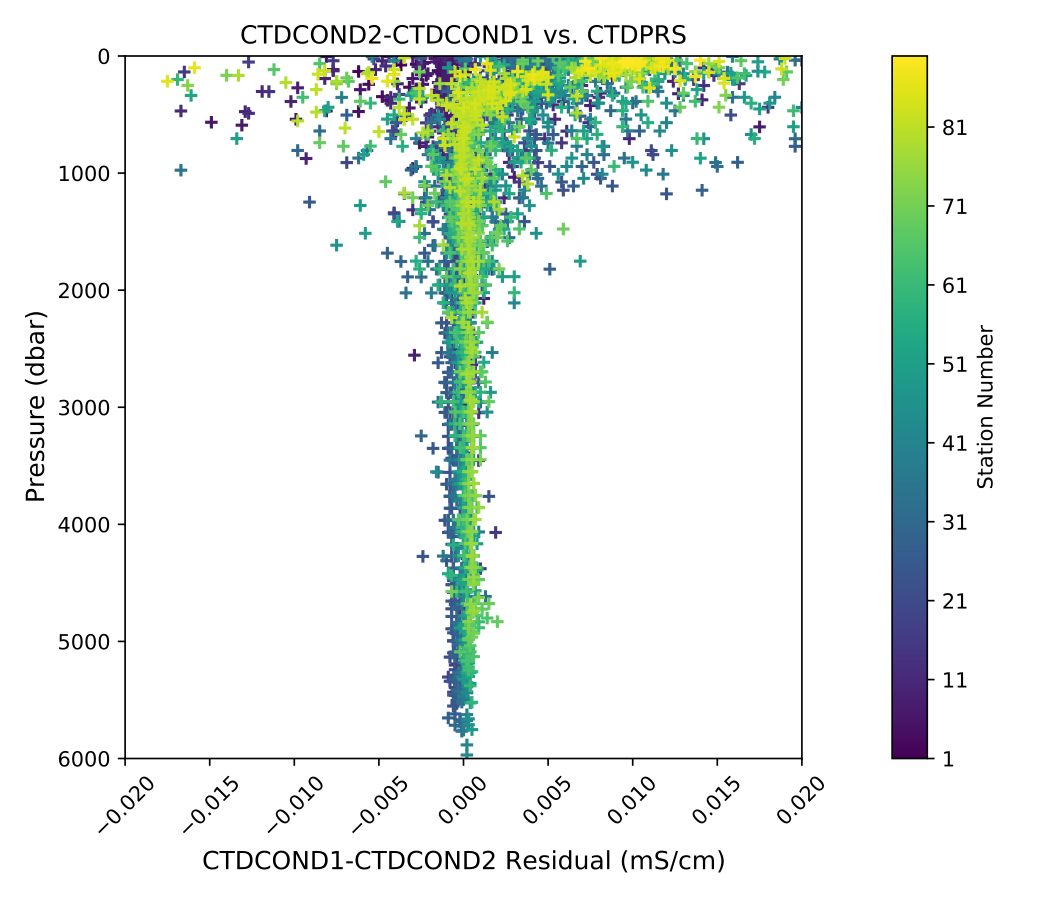
Corrected C1-C2 versus pressure.
A functioning SBE4C sensor typically exhibit a predictable modeled response. Offsets for each C sensor were determined using CBottle - CCTD differences in a deeper pressure range (500 or more dbars). After conductivity offsets were applied to all casts, response to pressure, temperature and conductivity were examined for each conductivity sensor. The response model is second-order with respect to pressure, second-order with respect to temperature, and second-order with respect to conductivity:

Fit coefficients are shown in the following tables.
Station |
|
|
|
|
|
|
|
|---|---|---|---|---|---|---|---|
901-90 |
0.0 |
-1.5095e-6 |
0.0 |
0.0 |
0.0 |
0.0 |
2.3449e-3 |
9-19 |
1.6923e-10 |
-1.3208e-6 |
0.0 |
0.0 |
0.0 |
-8.4712e-4 |
2.8040e-2 |
20-90 |
1.0156e-10 |
-1.0508e-6 |
0.0 |
0.0 |
0.0 |
-4.0501e-4 |
1.4077e-2 |


Station |
|
|
|
|
|
|
|
|---|---|---|---|---|---|---|---|
901-90 |
0.0 |
-9.2611e-7 |
0.0 |
0.0 |
0.0 |
0.0 |
4.8941e-3 |
9-19 |
0.0 |
-6.3966e-7 |
0.0 |
-7.0707e-4 |
0.0 |
0.0 |
5.249e-3 |
20-90 |
1.7710e-10 |
-1.6402e-6 |
0.0 |
0.0 |
0.0 |
-6.1245e-4 |
2.4370e-2 |
Salinity residuals after applying shipboard P/T/C corrections are summarized in the following figures. Only CTD and bottle salinity data with “acceptable” quality codes are included in the differences. Quality codes and comments are published in the APPENDIX of this report.
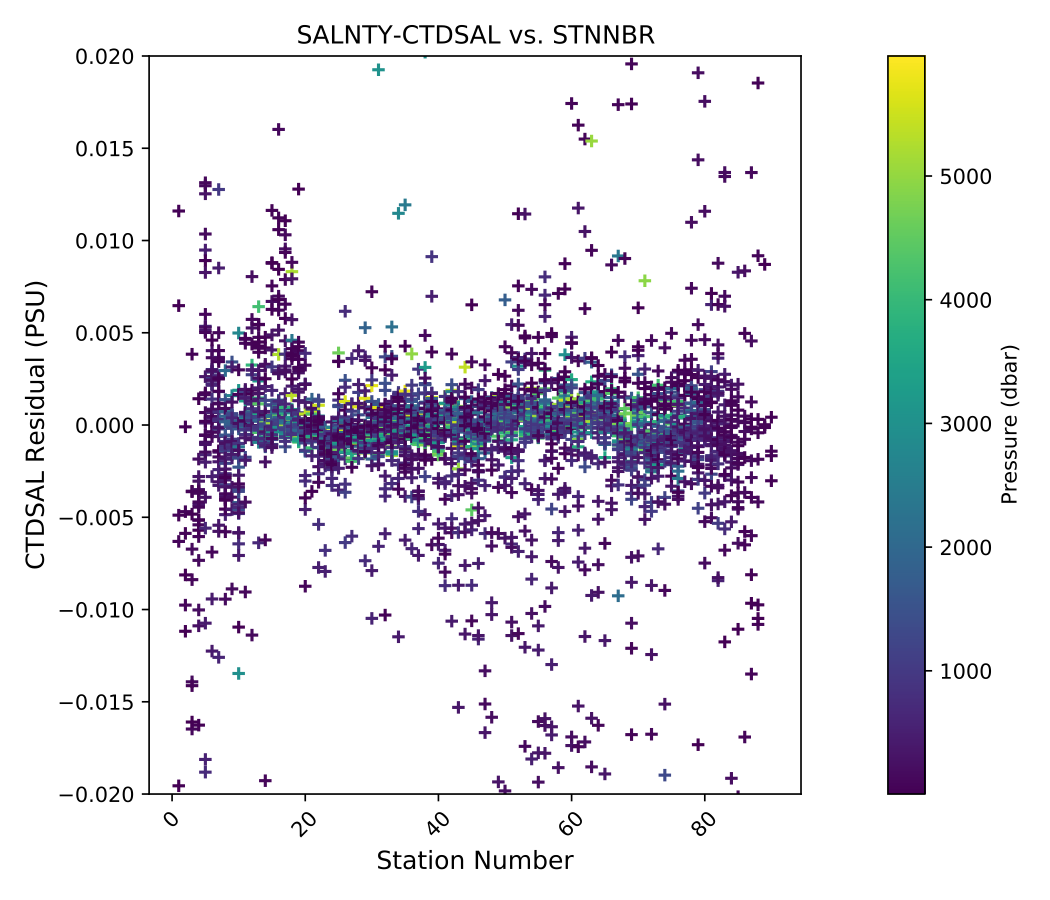
Salinity residuals versus station.
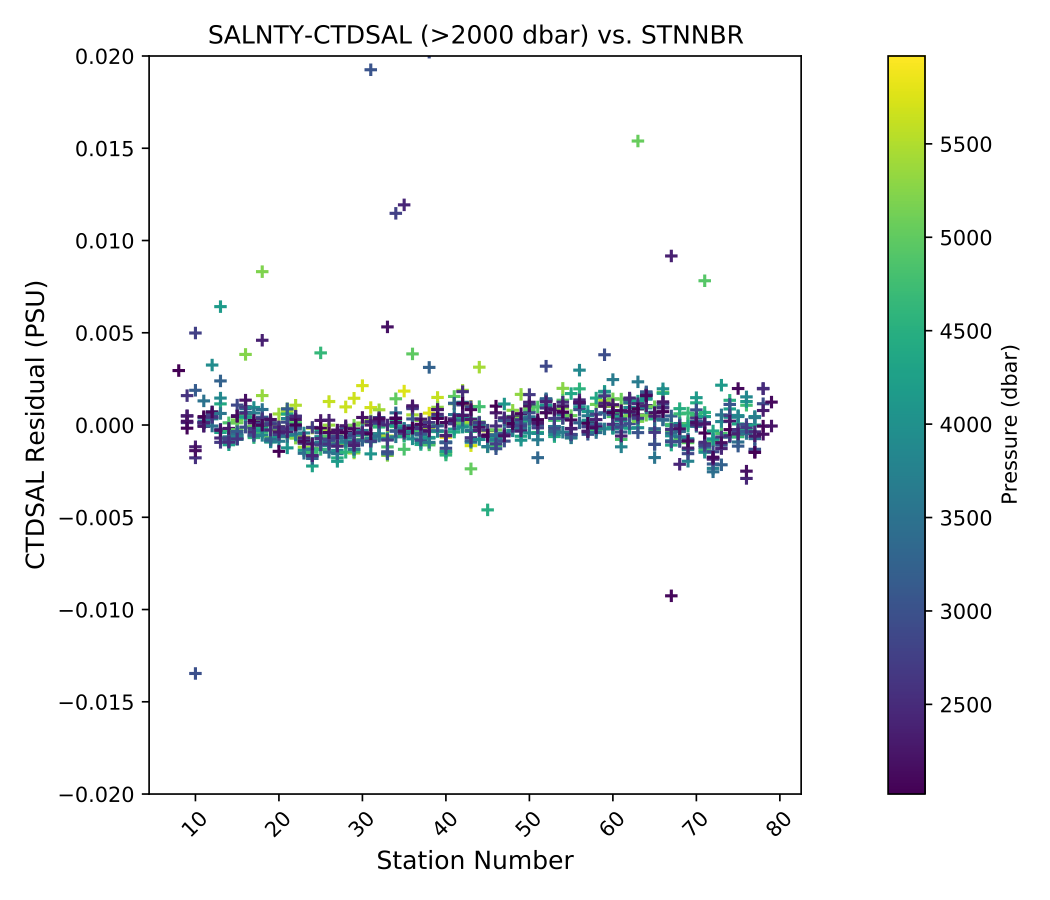
Deep Salinity residuals versus station (Pressure >= 2000dbar).
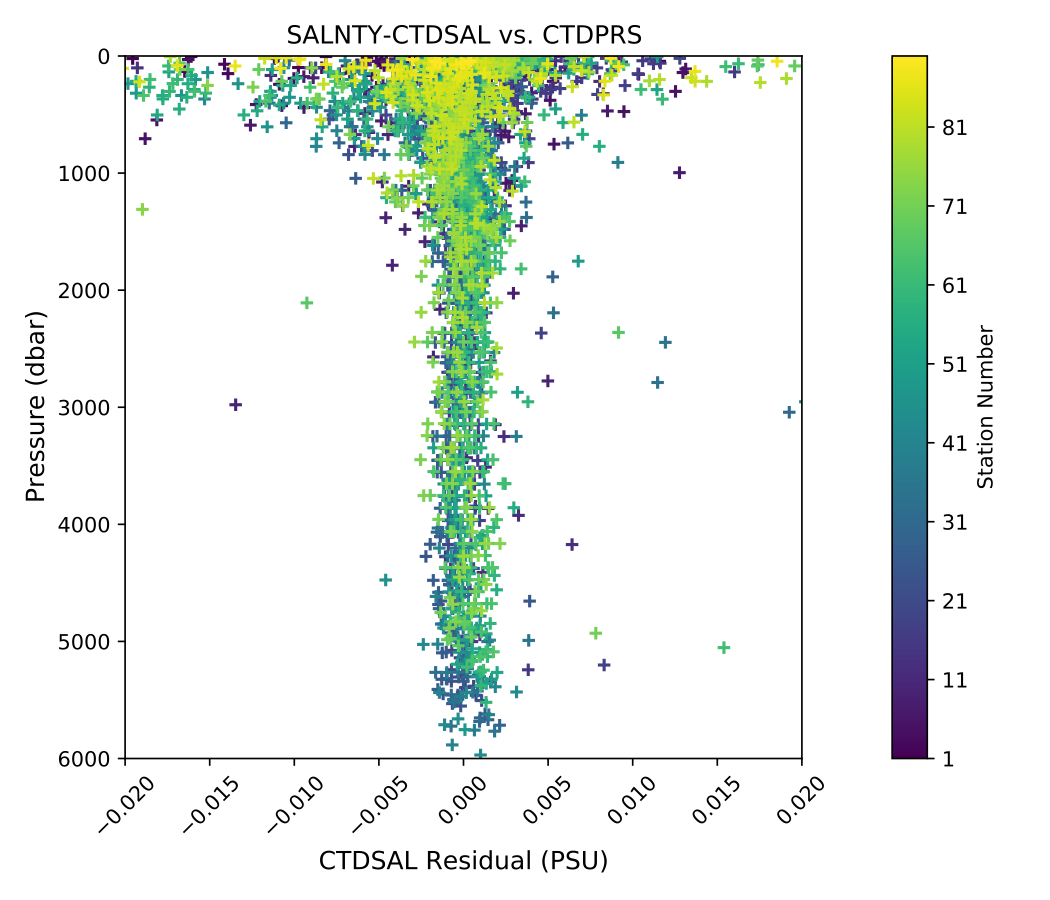
Salinity residuals versus pressure.
The 95% confidence limits for the mean low-gradient (values -0.002 mPSU T1-T2 0.002 mPSU) differences are ±0.00559 mPSU for salinity-C1SAL.
The 95% confidence limits for the deep salinity residuals (where pressure 2000dbar) are ±0.00163 mPSU for salinity-C1SAL.
- Minimal issues affected conductivity and calculated CTD salinities during this cruise.
Early stations had bottles fired on the fly.
The resulting affected sections of data have been coded and documented in the quality code APPENDIX.
CTD Dissolved Oxygen (SBE43)
Laboratory calibrations of the dissolved oxygen sensors were performed prior to the cruise at the SBE calibration facility. Dates of laboratory calibration are recorded on the underway sampling package table and calibration documents are provided in the APPENDIX.
The pre-cruise laboratory calibration coefficients were used to convert SBE43 frequencies to µmol/kg oxygen values for acquisition only. Additional shipboard fitting were performed to correct for the sensors non-linear response. Corrections for pressure, temperature, and conductivity sensors were finalized before analyzing dissolved oxygen data. Corrections for hysteresis are applied following Sea-Bird Application Note 64-3. The SBE43 sensor data were compared to dissolved O2 check samples taken at bottle stops by matching the downcast CTD data to the upcast trip locations along isopycnal surfaces. CTD dissolved O2 was then calculated using Clark Cell MPOD O2 sensor response model for Beckman/SensorMedics and SBE43 dissolved O2 sensors. The residual differences of bottle check value versus CTD dissolved O2 values are minimized by optimizing the PMEL DO sensor response model coefficients using the BFGS non-linear least-squares fitting procedure.
The general form of the PMEL DO sensor response model equation for Clark cells follows Brown and Morrison [Mill82] and Owens [Owen85]. Dissolved O2 concentration is then calculated:
![O_2 = S_{oc} \cdot (V + V_{\textrm{off}} + \tau_{20} \cdot e^{(D_1 \cdot p + D_2 \cdot (T - 20))} \cdot dV/dt) \cdot O_{sat} \cdot e^{T_{cor} \cdot T} \cdot e^{[(E \cdot p) / (273.15 + T)]}](_images/math/137e7775132524769d26b09758d3aafc1e389ada.png)
Where:
V is oxygen voltage (V)
D1 and D2 are (fixed) SBE calibration coefficients
T is corrected CTD temperature (°C)
p is corrected CTD pressure (dbar)
dV/dt is the time-derivative of voltage (V/s)
Osat is oxygen saturation
SOC, Voff,
 20, Tcor, and E are fit coefficients
All stations were fit together to get an initial coefficient estimate. Stations were then fit individually to refine the coefficients as the membrane does not deform the same way with each cast. If the fit of the individual cast had worse resdiuals than the group, they were reverted to the original group fit coefficients.
Station |
Soc |
Voff |
|
Tcor |
E |
|---|---|---|---|---|---|
901-90 |
4.6882e-1 |
-4.9580e-1 |
1.20 |
-1.6209e-4 |
3.7331e-2 |
CTD dissolved O2 residuals are shown in the following figures O2 residuals versus station. through Deep O2 residuals versus station (Pressure >= 2000dbar)..
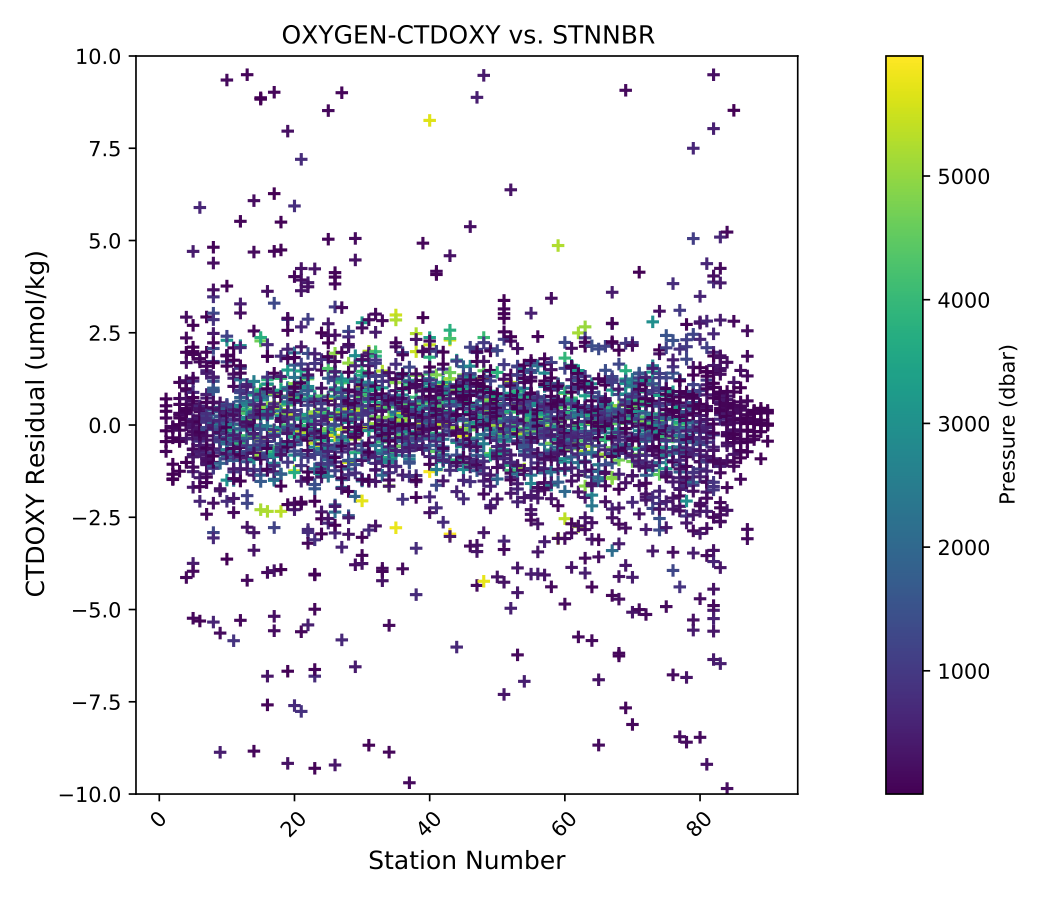
O2 residuals versus station.
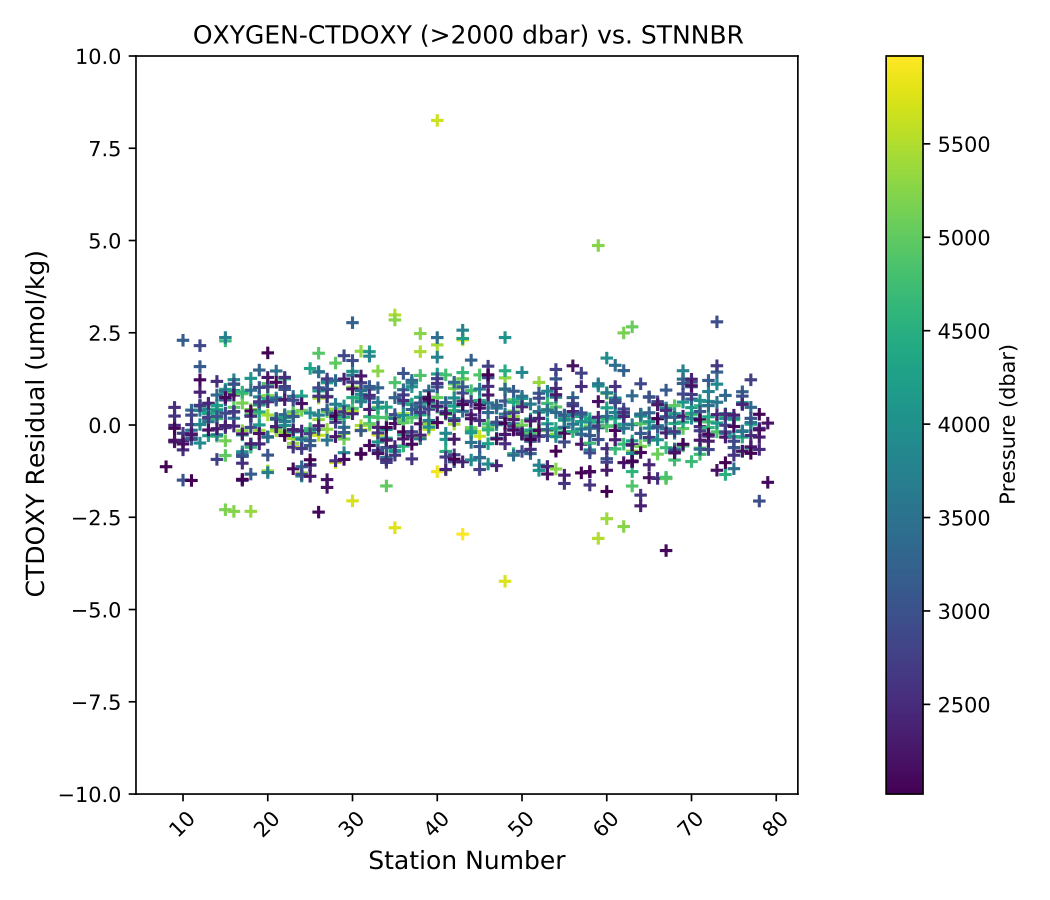
Deep O2 residuals versus station (Pressure >= 2000dbar).
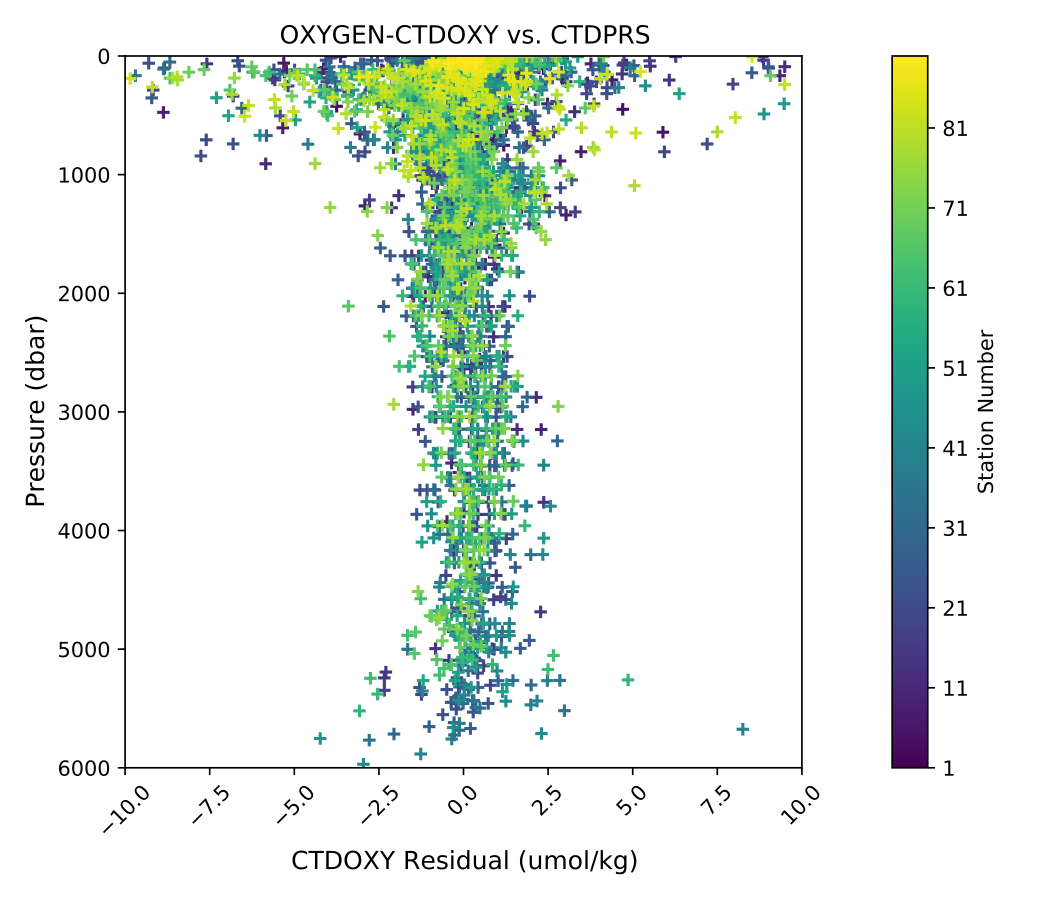
O2 residuals versus pressure.
The 95% confidence limits of 1.69 (µmol/kg) for all acceptable (flag 2) dissolved oxygen bottle data values and 1.61 (µmol/kg) for deep dissolved oxygen values are only presented as general indicators of the goodness of fit. CLIVAR GO-SHIP standards for CTD dissolved oxygen data are < 1% accuracy against on board Winkler titrated dissolved O2 lab measurements.
- A number of complications arose with the acquisition and processing of CTD dissolved oxygen data.
Multiple SBE43 sensors were suspected to have frozen during transit or while sitting in port, causing erratic issues in the upper 100 m.
All compromised data signals were recorded and coded in the data files. The bottle trip levels affected by the signals were coded and are included in the bottle data comments section of the APPENDIX.
CTD Dissolved Oxygen (RINKO)
A two-point calibration was performed prior and after deployment on the rosette. These calibrations produced sets of calibration coefficients (G and H) to adjust factory calibration of dissolved oxygen raw voltage. The calibrations also provided an assessment of foil degradation over the course of the 90 stations. As per manufacturer (JFE Advantech Co., Ltd.) recommendation, 100% saturation points were obtained via bubbling ambient air in a stirred beaker of tap water about 30 minutes, removing air stone, then submersing the powered Rinko. Zero point calibrations also followed general manufacturer recommendations, using a sodium sulfite solution (25g in 500mL deionized water). Dissolved oxygen raw voltage (DOout), atmospheric pressure, and solution temperature were recorded for calculation of new oxygen sensor coefficients (G and H).
Rinko temperature (factory coefficients) was used for pre-cruise calibration. Generally, the Rinko III sensor appears to have performed as expected with no major problems or sharp drift throughout the deployment. An SBE 43 dissolved oxygen sensor was deployed simultaneously. Both oxygen sensor data sets were analyzed and quality controlled with Winkler bottle oxygen data. SBE 43 data are reported as primary oxygen (CTDOXY) for Stations 1-35, with Rinko III data used for the remaining stations (36-90).
RINKO data was acquired, converted from volts to oxygen saturation, and then multipled by the oxygen solubility to find values in µmol/kg. The resulting data were then fitted using the equations developed by [Uchida08]:
![[O_2] = (V_0 / V_c - 1) / K_{sv}](_images/math/ae4cc704585aaee775c56d54979fec7c36552f21.png)

where:
T is temperature (ºC)
Vr is raw voltage (V)
V0 is voltage at zero O2 (V)
c0, c1, c2, d0, d1, d2 are calibration coefficients
Oxygen is further corrected for pressure effects:
![[O_2]_c = [O_2] (1 + c_p P / 1000) ^ {1/3}](_images/math/e989c5e85c133147131fa06de23a391ffc7d3bce.png)
where:
P is pressure (dbar)
cp is pressure compensation coefficient
Lastly, salinity corrections are applied [GarciaGordon1992]:
![[O_2]_{sc} = [O_2]_c \exp[{S (B_0 + B_1 T_S + B_2 T_S^2 + B_3 T_S^3) + C_0 S^2}]](_images/math/3121d523d4b964d5b54210549fad08494126e6c3.png)
where:
TS is scaled temperature (TS = ln[(298.15 – T)/(273.15 + T)])
B0, B1, B2, B3, C0 are solubility coefficients
All stations were fit together to get an initial coefficient estimate. Stations were then fit in groups of similar profiles to get a further refined estimate. Individual casts were then fit to remove the noticeable time drift in coefficients If the fit of the individual cast had worse resdiuals than the group, they were reverted to the original group fit coefficients.
Station |
|
|
|
|
|
|
|
|---|---|---|---|---|---|---|---|
901-18 |
1.8737 |
4.7519e-2 |
1.1875e-3 |
7.2293e-3 |
-2.2105e-1 |
3.1239e-1 |
7.7734e-2 |
19-37 |
1.8699 |
6.6118e-2 |
1.406e-3 |
1.4025e-2 |
-2.2853e-1 |
3.1893e-1 |
8.586e-2 |
38-70 |
1.8734 |
-8.3703e-3 |
9.3629e-4 |
-6.6252e-3 |
-1.9367e-1 |
3.0974e-1 |
1.1084e-1 |
71-90 |
7.8045e-1 |
3.7031e-2 |
-2.5300e-4 |
5.8055e-3 |
-3.9786e-2 |
3.2919e-1 |
5.0959e-2 |


CTD dissolved O2 residuals are shown in the following figures.
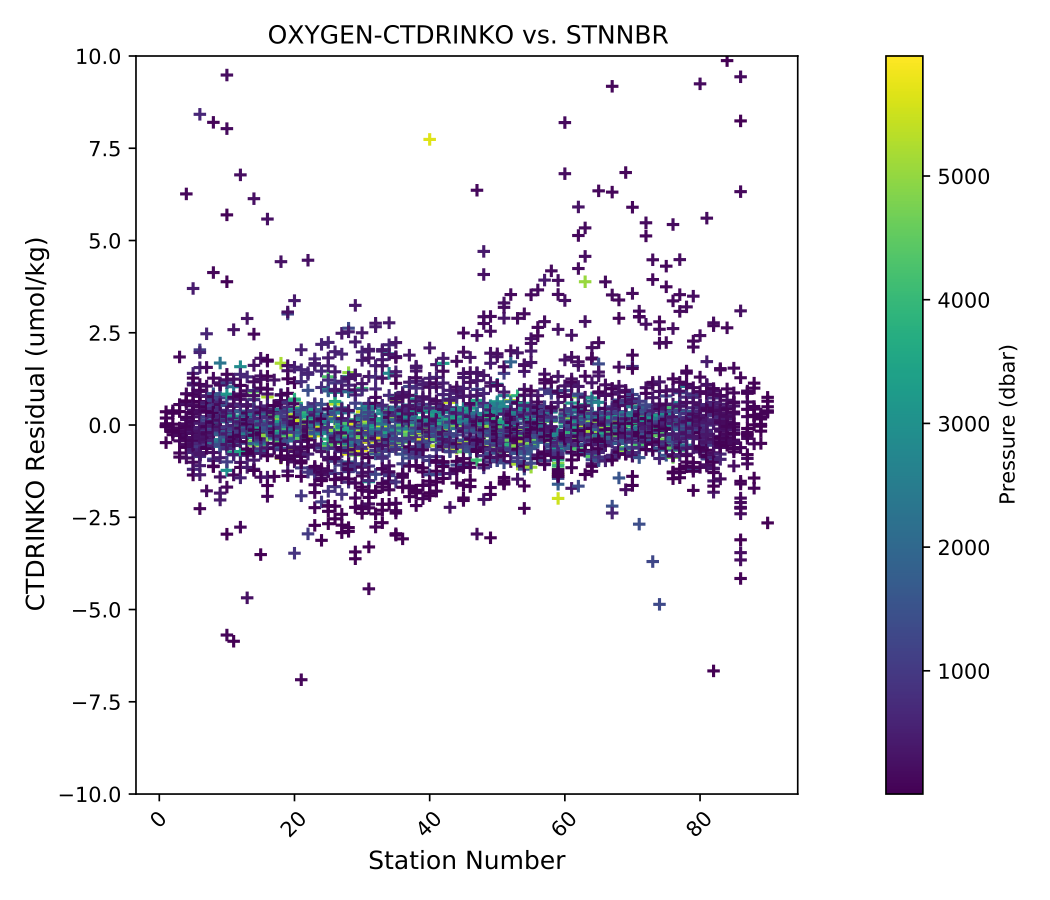
O2 residuals versus station.
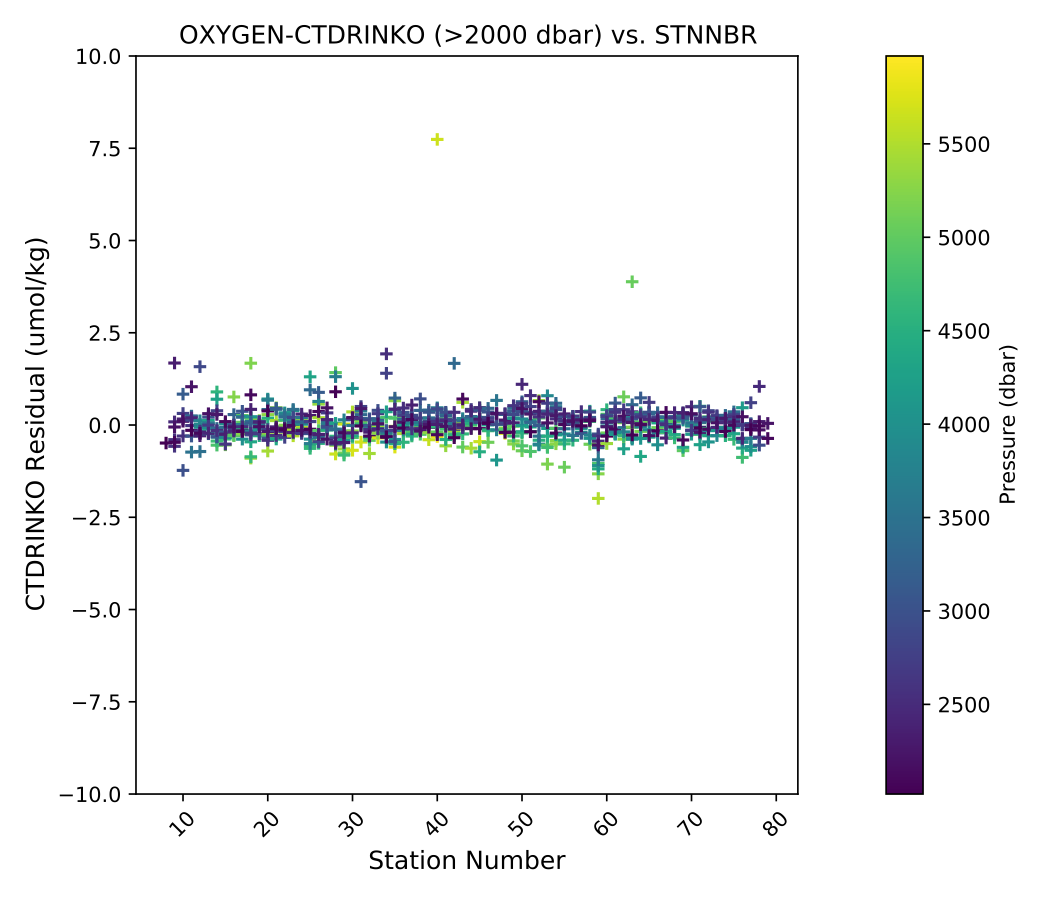
Deep O2 residuals versus station (Pressure >= 2000dbar).
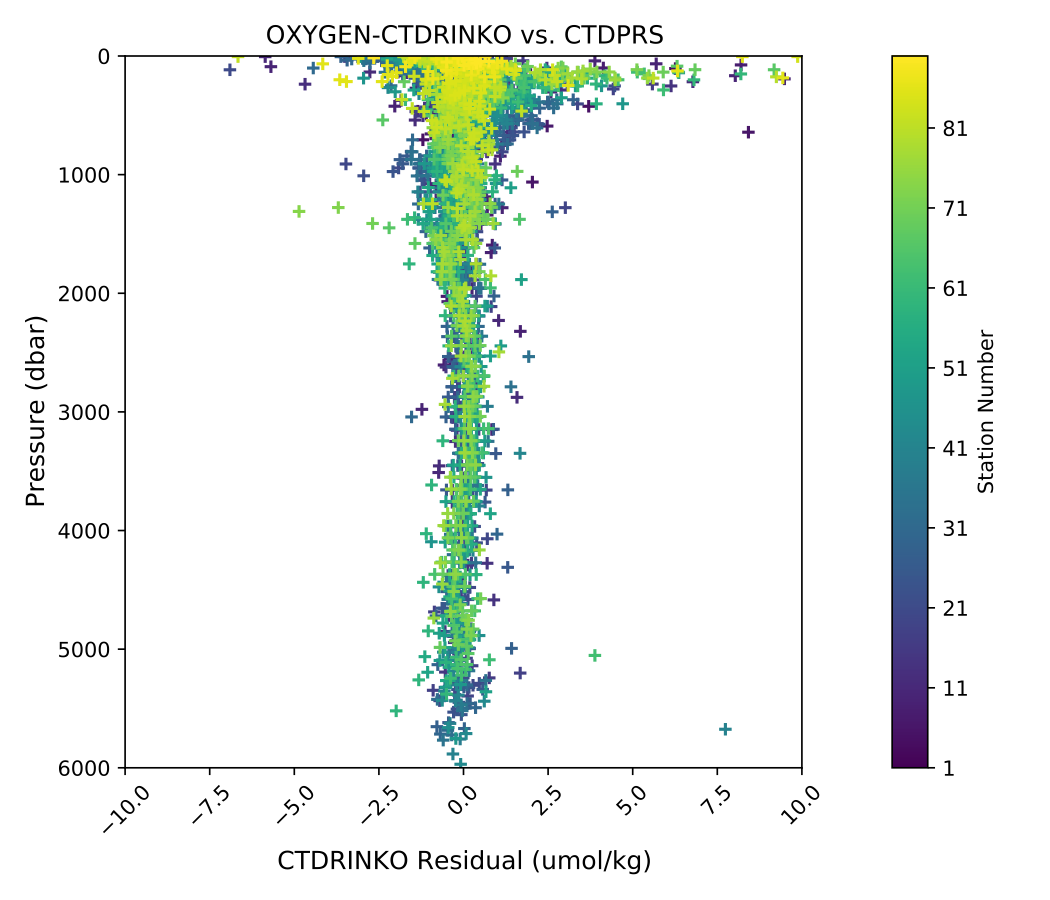
O2 residuals versus pressure.
The 95% confidence limits of 1.35 (µmol/kg) for all acceptable (flag 2) dissolved oxygen bottle data values and 0.91 (µmol/kg) for deep dissolved oxygen values are only presented as general indicators of the goodness of fit. CLIVAR GO-SHIP standards for CTD dissolved oxygen data are < 1% accuracy against on board Winkler titrated dissolved O2 lab measurements.
- A number of complications arose with the acquisition and processing of CTD dissolved oxygen data.
Rinko S/N 297 was very noisy for the first ~35 casts and subsequently replaced with S/N 296 which had a much cleaner signal.
- Mill82
Millard, R. C., Jr., “CTD calibration and data processing techniques at WHOI using the practical salinity scale,” Proc. Int. STD Conference and Workshop, p. 19, Mar. Tech. Soc., La Jolla, Ca. (1982).
- Owen85
Owens, W. B. and Millard, R. C., Jr., “A new algorithm for CTD oxygen calibration,” Journ. of Am. Meteorological Soc., 15, p. 621 (1985).
- Uchida08
Uchida, H., Kawano, T., Kaneko, I., Fukasawa, M. “In Situ Calibration of Optode-Based Oxygen Sensors,” J. Atmos. Oceanic Technol., 2271-2281, (2008)
- GarciaGordon1992
García, H. E., and L. I. Gordon, 1992: Oxygen solubility in sea- water: Better fitting equations. Limnol. Oceanogr., 37, 1307– 1312.