Discrete pCO2
- PIs
Rik Wanninkhof (NOAA/AOML)
- Analysts
Patrick Mears (CIMAS/RSMAS)
Sampling
Samples were drawn from 11-L Niskin bottles into 500 ml glass bottles using nylon tubing with a Silicone adapter that fit over the drain cock. Bottles were first rinsed three times with ~25 ml of water. They were then filled from the bottom, overflowing a bottle volume while taking care not to entrain any bubbles. About 5 ml of water was withdrawn to allow for expansion of the water as it warms and to provide space for the stopper and tubing of the analytical system. Saturated mercuric chloride solution (0.24 ml) was added as a preservative. The sample bottles were sealed with glass stoppers lightly covered with grease and were stored at room temperature for a maximum of fourteen hours prior to being run.
The analyses for pCO2 were done with the discrete samples at 20ºC. A primary water bath was kept within 0.03ºC of the analytical temperature; a secondary bath was kept within 0.3ºC the analytical temperature. The majority of the samples were analyzed in batches of twelve bottles, which took approximately 3.5 hours including the six standard gases. When twelve bottles were moved into the primary water bath for analyses, the next twelve bottles were moved into the secondary water bath. No sample bottle spent less than two hours in the secondary water bath prior to being moved to the analytical water bath. Duplicate samples from the same Niskin were drawn to check the precision of the sampling and analysis.
1260 samples were drawn from 63 CTD casts. 62 sets of duplicate bottles were drawn at numerous depths. The average relative standard error was 0.15%, while the median relative error was 0.09%.
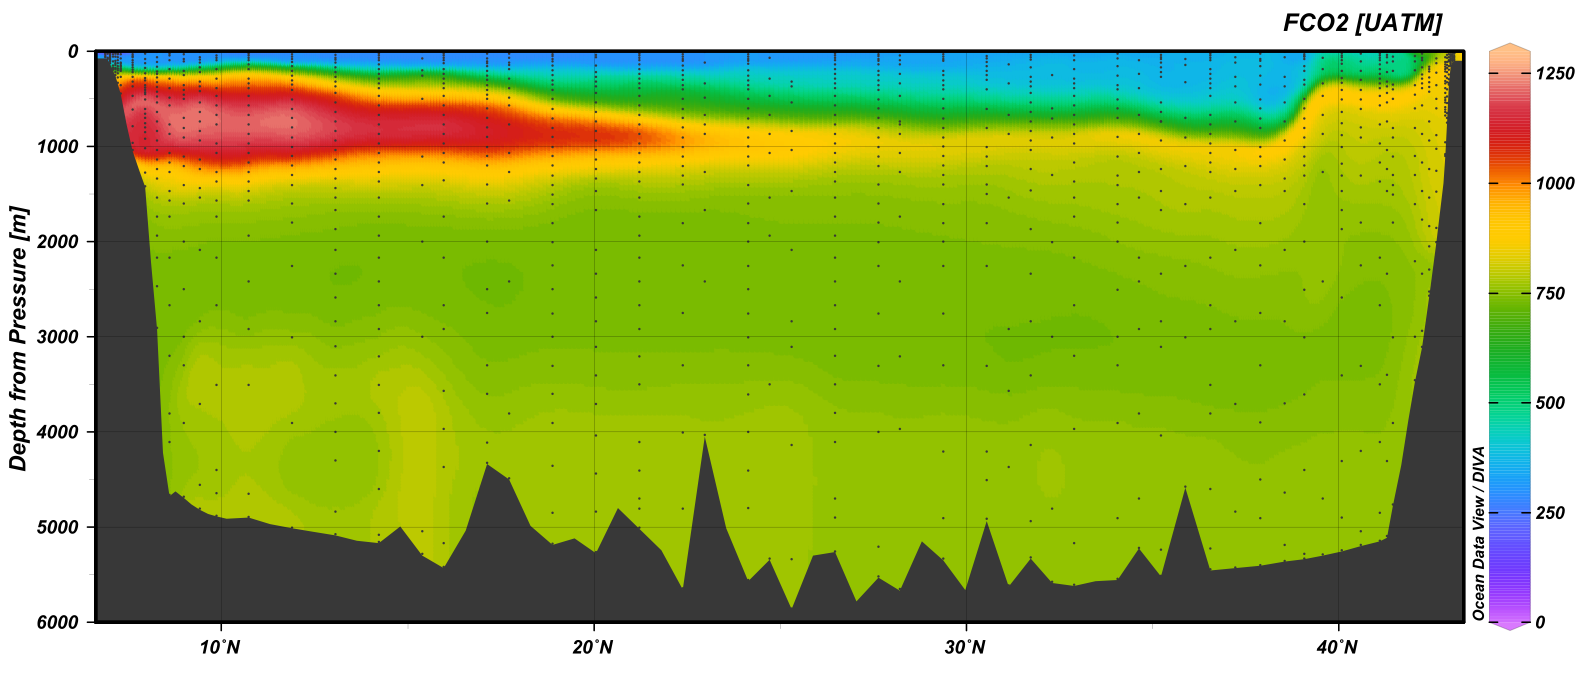
fCO2 (uatm) section plot of the GO-Ship A20 section.
An error in a USB hub connection resulted in the analysis program becoming frozen and draining one of the samples on station 9. A loose connection with the potentiometer controlling the sample water and gas flow resulted in a few delays but did not cause the loss of any samples. At the Southern most stations the surface water had measured values less than the lowest standard.
Underway Sampling
Underway samples were collected from the underway seawater line located in the aft wetlab that is connected to the same seawater line as the underway pCO2 system located in the hydrolab. The seawater is pumped from a bow seawater inlet located approximately 5.3 meters below the waterline through a sea chest where instruments measure and record temperature and salinity.
From the UW seawater line, 37 samples including duplicates were drawn during the transit from Port Everglades, Florida to Woods Hole and from Woods Hole to the first station.
Analyzer Description
The principles of the discrete pCO2 system are described in [Wanninkhof1993] and [Chipman1993]. The major difference in the current system is the method of equilibrating the sample water with the constantly circulating gas phase. This system uses miniature membrane contactors (Micromodules from Memrana, Inc.), which contain bundles of hydrophobic micro-porous tubes in polycarbonate shells (2.5 x 2.5 x 0.5 cm). The sample water is pumped over the outside of the tubing bundles in two contactors in series at approximately 25 ml/min and to a drain. The gas is recirculated in a vented loop, which includes the tubing bundles and a non-dispersive infrared analyzer (LI-COR™ model 840) at approximately 32 ml/min.
The flow rates of the water and gas are chosen with consideration of competing concerns. Faster water and gas flows yield faster equilibration. A slower water flow would allow collection of smaller sample volume; plus a slower gas flow would minimize the pressure increase in the contactor. Additionally, the flow rates are chosen so that the two fluids generate equal pressures at the micro-pores in the tubes to avoid leakage into or out of the tubes. A significant advantage of this instrumental design is the complete immersion of the miniature contactors in the constant temperature bath. Also in the water bath are coils of stainless steel tubing before the contactors that ensure the water and gas enter the contactors at the known equilibration temperature.
The instrumental system employs a large insulated cooler (Igloo Inc.) that accommodates twelve sample bottles, the miniature contactors, a water circulation pump, a copper coil connected to a refrigerated circulating water bath, an immersion heater, a 12-position sample distribution valve, two thermistors, and two miniature pumps. The immersion heater works in opposition to the cooler water passing through the copper coil. One thermistor is immersed in the water bath, while the second thermistor is in a sample flow cell after the second contactor. The difference between the two thermistor readings was consistently less than 0.02ºC during sample analyses. In a separate enclosure are the 8-port gas distribution valve, the infrared analyzer, a barometer, and other electronic components. The gas distribution valve is connected to the gas pump and to six standard gas cylinders.
To ensure analytical accuracy, a set of six gas standards (ranging from 288 to 1534 ppm) was run through the analyzer before and after every sample batch. The standards were obtained from Scott-Marin and referenced against primary standards purchased from C.D. Keeling in 1991, which are on the WMO-78 scale.
A custom program developed using LabView™ controls the system and graphically displays the CO2 concentration as well as the temperatures, pressures and gas flow during the 15-minute equilibration. The analytical system was running well enough that the equilibration period was shortened to 12 minutes for the second half of the cruise. The CO2 in the gas phase changes greatly within the first minute of a new sample and then goes through nearly two more oscillations. The oscillations dampen quickly as the concentration asymptotically approaches equilibrium. The flows are stopped, and the program records an average of ten readings from the infrared analyzer along with other sensor readings. The data files from the discrete pCO2 program are reformatted so that a Matlab program designed for processing data from the continuous pCO2 systems can be used to calculate the fugacity of the discrete samples at 20ºC. The details of the data reduction are described in [Pierrot2009].
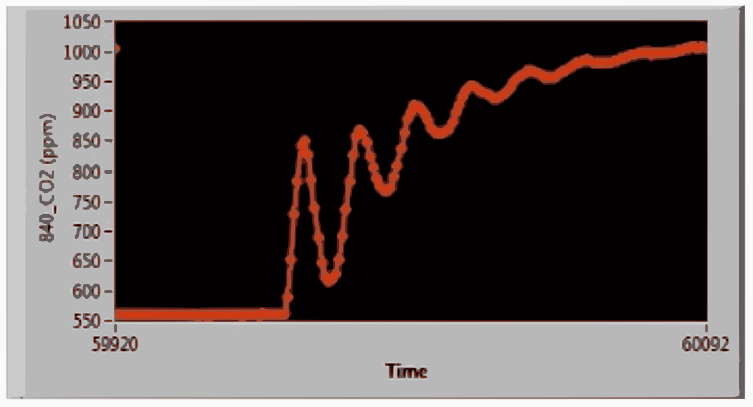
CO2 oscillations during start of first sample in set of twelve
The instrumental system was originally designed and built by Tim Newberger and was supported by C. Sweeney and T. Takahashi. Their skill and generosity has been essential to the successful use and modification of this instrumental system. Francesca Alatrorre provided greatly needed assistance in collecting samples.
Cylinder # |
ppm CO2 |
|---|---|
JB03282 |
288.46 |
JB03268 |
384.14 |
CB11243 |
591.61 |
CA05980 |
792.51 |
CA05984 |
1036.95 |
CA05940 |
1533.7 |
- Chipman1993
Chipman, D.W., J. Marra, and T. Takahashi, 1993: Primary production at 47ºN and 20ºW in the North Atlantic Ocean: A comparison between the 14C incubation method and mixed layer carbon budget observations. Deep-Sea Res., II, v. 40, pp. 151-169.
- Wanninkhof1993
Wanninkhof, R., and K. Thoning, 1993: Measurement of fugacity of CO2 in surface water using continuous and discrete sampling methods. Mar. Chem., v. 44, no. 2-4, pp. 189-205.
- Pierrot2009
Pierrot, D., C. Neill, K. Sullivan, R. Castle, R.Wanninkhof, H. Luger, T. Johannessen, A. Olsen, R.A. Feely, C.E. Cosca, 2009: Recommendations for autonomous underway pCO2 measuring systems and data-reduction routines . Deep-Sea Res., II, v. 56, pp. 512-522.